![]()
Mick Semb Wever
Monitoring Cassandra using Intel Snap and Grafana
This blog post describes how to monitor Apache Cassandra using the Intel Snap open source telemetry framework. The document also covers some introductory knowledge on how monitoring in Cassandra works. It will use Apache Cassandra 3.0.10 and the resulting monitoring metrics will be visualised using Grafana. Docker containers will be used for Intel Snap and Grafana.
The basics of Docker will not be explained, as plenty of documentation on that exists already.
How the Metrics Reporter works
Rather than re-invent the wheel explaining how metrics are configured and work in Cassandra let’s repeat the community’s documentation here.
Metrics in Cassandra are managed using the Dropwizard Metrics library. These metrics can be queried via JMX or pushed to external monitoring systems using a number of built in and third party reporter plugins. … The configuration of these plugins is managed by the metrics reporter config project. There is a sample configuration file located at conf/metrics-reporter-config-sample.yaml.
Once configured, you simply start cassandra with the flag -Dcassandra.metricsReporterConfigFile=metrics-reporter-config.yaml. The specified .yaml file plus any 3rd party reporter jars must all be in Cassandra’s classpath.
– from Cassandra’s Monitoring documentation
Configuring the Cassandra metrics’ Reporter
Installing MX4j for Intel Snap
Typically metrics libraries: like Graphite, StatsD and Riemann; push metrics from Cassandra’s internal MBeans through the Metrics library to a configured metrics collector or backend. Intel Snap instead pulls metrics from Cassandra via MX4j.
Intel Snap runs as a small process on each node acting as a collector pulling metrics from different processes and forwarding them (potentially aggregated first) to its backend daemon.
MX4j must be installed in Cassandra so to provide the HTTP interface that Intel Snap pulls metrics from.
Download the following zipfile:
- MX4J-3.0.2 : https://sourceforge.net/projects/mx4j/files/MX4J%20Binary/3.0.2/mx4j-3.0.2.zip/download
Extract from the zipfile /mx4j-3.0.2/lib/mx4j-tools.jar and add it to the $CASSANDRA_HOME/lib/ directory.
Restart Cassandra.
When successfully loaded the following will show up in the log:
HttpAdaptor version 3.0.2 started on port 8081
INFO  01:08:39 mx4j successfuly loaded
Push vs Pull metrics
There are various pro and cons to push versus pull metrics.
Push metrics ensure the application itself configures the schedule and amount of metrics read internally and pushed out, therefore being responsible to the load placed upon itself. Push metrics presume therefore that the collector receiving the metrics can handle the load.
Pull metrics create a load upon a resource or application externally. Care must be taken with this external configuration of the collector so that it does not pull metrics at a frequency or volume that the resource or application is unable to handle (or creates an unacceptable burden making it unable to perform its function).
A way to check the impact of Intel Snap pulling metrics is described below under Impact of System performance of Intel Snap collectors.
Installing Intel Snap

The simplest way to get a local Intel Snap daemon running on a node is to use Docker:
docker run -it --net=host intelsdi/snap
The Docker container uses the intelsdi/snap image. This was tested using Docker-1.12.6. The --net=host option allows the container to simply re-use the host’s network interface as-is. This is required as Intel Snap is expected to be running next to Cassandra and have access to the MX4J http port 8081.
To test the Snap process running in the daemon execute the snaptel metric list command within the Docker container:
docker exec -i -t `docker ps | grep "intelsdi/snap" | awk '{print $1}'` snaptel metric list
This will output “No metrics found. Have you loaded any collectors yet?” as no plugins, tasks, nor metrics have been configured yet.
At this point we have Intel Snap running in non-tribe mode.
Installing Intel Snap system plugins
First let’s install some basic system Snap plugins.
Download the following plugins:
- snap-plugin-collector-interface
- snap-plugin-collector-iostat
- snap-plugin-collector-load
- snap-plugin-collector-processes
- snap-plugin-collector-disk
- snap-plugin-collector-use
Then activate the collector using the following commands:
ls snap-plugin-collector-* | xargs -i docker cp {} `docker ps | grep "intelsdi/snap" | awk '{print $1}'`:/
docker exec -i -t `docker ps | grep "intelsdi/snap" | awk '{print $1}'` bash
ls snap-plugin-collector-* | xargs -i  snaptel plugin load {}
For each plugin loaded a success message will be printed reporting name, version, type, signed, and loaded time.
These collector plugins is now registered. This can be checked with the following command:
snaptel plugin list
Next step is to create tasks for each of these plugins that will be configured to collect metrics from the local machine. Download the following task files:
Create tasks for each of them using the following commands:
ls *-task.json | xargs -i docker cp {} `docker ps | grep "intelsdi/snap" | awk '{print $1}'`:/
docker exec -i -t `docker ps | grep "intelsdi/snap" | awk '{print $1}'` bash
ls *-task.json | xargs -i  snaptel task create -t {}
For each task successfully created a message will be printed: reporting ID, name, and its state. This can be double checked with:
snaptel task list
The metrics being collected through this task can now be viewed on the command line with:
snaptel task watch <task_id>
More plugins can be found listed at https://github.com/intelsdi-x/snap/blob/master/docs/PLUGIN_CATALOG.md
Installing Intel Snap Cassandra plugin

The next step is to add the Cassandra collector plugin to Snap and to configure a task to it.
Download the Cassandra collector plugin: snap-plugin-collector-cassandra
Then activate the collector using the following commands:
docker cp snap-plugin-collector-cassandra `docker ps | grep "intelsdi/snap" | awk '{print $1}'`:/
docker exec -i -t `docker ps | grep "intelsdi/snap" | awk '{print $1}'` bash
snaptel plugin load snap-plugin-collector-cassandra
Successful output is:
Plugin loaded
Name: cassandra
Version: 3
Type: collector
Signed: false
Loaded Time: Fri, 27 Jan 2017 02:34:36 UTC
The Cassandra collector plugin is now registered. This can be checked with the following command:
snaptel plugin list
Output should resemble the following:
NAME 		 VERSION 	 TYPE 		 SIGNED 	 STATUS 	 LOADED TIME
cassandra 	 3 		 collector 	 false 		 loaded 	 Fri, 27 Jan 2017 02:34:36 UTC
The metrics that can be pulled using this plugin can be listed using:
snaptel metric list
The next step is to configure a task that uses this plugin to pull metrics from Cassandra’s MX4J’s http interface. Create a file cassandra-task.json that reads:
{
    "version": 1,
    "schedule": {
        "type": "simple",
        "interval": "1s"
    },
    "workflow": {
        "collect": {
            "metrics": {
"/intel/cassandra/node/*/org_apache_cassandra_metrics/type/Table/name/*/MeanRate":{},
"/intel/cassandra/node/*/org_apache_cassandra_metrics/type/Table/scope/*/name/*/MeanRate":{},
"/intel/cassandra/node/*/org_apache_cassandra_metrics/type/Table/keyspace/*/name/*/MeanRate":{},
"/intel/cassandra/node/*/org_apache_cassandra_metrics/type/Table/keyspace/*/scope/*/name/*/MeanRate":{},
"/intel/cassandra/node/*/org_apache_cassandra_metrics/type/Keyspace/keyspace/*/name/*/MeanRate":{},
"/intel/cassandra/node/*/org_apache_cassandra_metrics/type/DroppedMessage/scope/*/name/Dropped/MeanRate":{},
"/intel/cassandra/node/*/org_apache_cassandra_metrics/type/ClientRequest/scope/*/name/*/MeanRate":{}
            },
            "config": {
                "/intel/cassandra": {
                    "url": "127.0.0.1",
                    "port": 8081
                }
            }
        }
    }
}
Then load this file as a task into Snap:
docker cp cassandra-task.json `docker ps | grep "intelsdi/snap" | awk '{print $1}'`:/
docker exec -i -t `docker ps | grep "intelsdi/snap" | awk '{print $1}'` bash
snaptel task create -t cassandra-task.json
Successful output will be similar to:
Using task manifest to create task
Task created
ID: e5a33996-5900-4df6-972f-21ab9f7ffc1d
Name: Task-e5a33996-5900-4df6-972f-21ab9f7ffc1d
State: Running
This can be double checked with:
snaptel task list
Output should resemble:
ID	 NAME		 STATE 		 HIT 	 MISS 	 FAIL 	 CREATED 		 LAST FAILURE
e5…     Task-e5… 	 Running 	 23 	 139 	 0 	 2:50AM 1-27-2017
The metrics being collected through this task can now be viewed on the command line with:
snaptel task watch <task_id>
Impact of System performance of Intel Snap collectors
Given Intel Snap collectors pull, or poll, for metrics and the state of the collector plugins are in variable degrees of stability, it is worthwhile to determine the impact each collector task has upon the local machine.
The impact each Intel Snap collector plugin is imposing on the system can be quickly checked using the following command (the 9th column displays cpu%):
top -bc | grep snap-plugin-collector
If a particular collector is imposing excessive load (more than a few percentage cpu) it should be addressed by either increasing the schedule interval time or reducing the workflow collect metrics the task is configured to collect. Both these settings are found in the task json. Altering them does require the task to be removed and created again.
Installing Intel Snap in tribe mode
Clustering Snap becomes important in any realistic test or production environment. Snap’s clustering feature is called Tribe. Once configured any snaptel command executed operates to all snapteld processes within the configured tribe cluster. That is plugins loaded and tasks created are global to the whole cluster.
The following describes the simplest approach to using tribe, taking use of all defaults.
Start each snapteld with tribe enabled using the following command:
snapteld --tribe -t 0
The Docker equivalent command for this is:
docker run -it --net=host -e "Snap_TRIBE=true" intelsdi/snap
Create a tribe cluster (called an “agreement”) using the following command:
snaptel agreement create all-nodes
Join the local snapteld process to the newly created tribe agreement using the following command:
snaptel agreement join all-nodes `hostname`
Further documentation on running Intel Snap processes together is found here.
Installing Grafana
With both Cassandra and Intel Snap running locally, and because Snap is running in non-tribe mode, we need to run Grafana locally as well. The simplest way to get a local Grafana server running via Docker is to:
docker run -it --net=host -e "GF_INSTALL_PLUGINS=raintank-snap-app" grafana/grafana
This was tested using Docker-1.12.6. The –net=host option allows the container to simply re-use the host’s network interface as-ias. This is simpler than specifying each port explicitly like:
docker run -it -p 3000:3000 -e "GF_INSTALL_PLUGINS=raintank-snap-app" grafana/grafana
The GF_INSTALL_PLUGINS=raintank-snap-app Docker variable enables the Intel Snap plugin in Grafana. This Docker container uses the grafana/grafana image.
Then to start visualising metrics collected by Intel Snap using Grafana follow the subsequent steps:
- Open up Grafana in a browser at http://localhost:3000
- Log in. Unconfigured the username/password is admin/admin.
-
Under
“Installed Apps”enable the Snap app, by pressing the“Enable now”link and the subsequently the“Enable”button. -
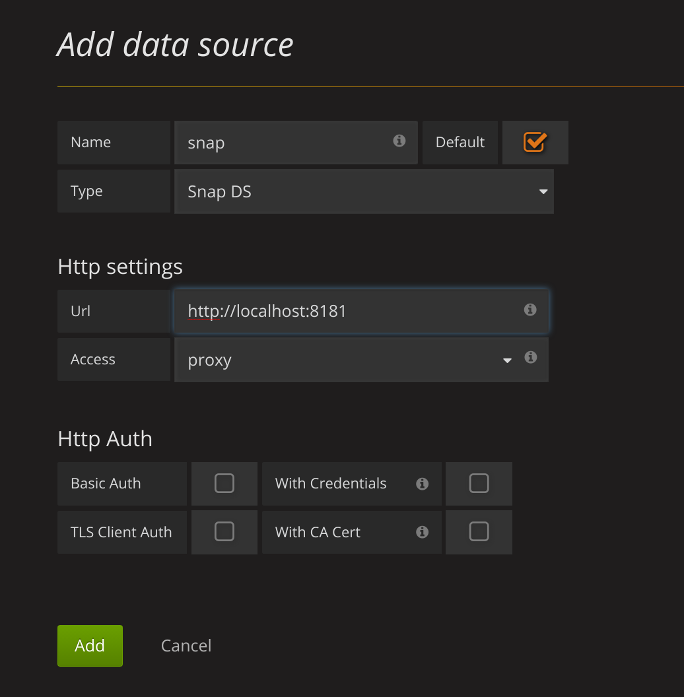
Add the default datasource, connecting to Snap DS.
Menu->Data Sources - Note: the Snap DS is not an actual database. The metrics it can display are only those streamed live via the
snaptel task watch <task_id>functionality. This is ok for ad-hoc exploration, but infrastructure for a production environment will configure the Snap metrics published into a database to permit post-mortem exploration.
-
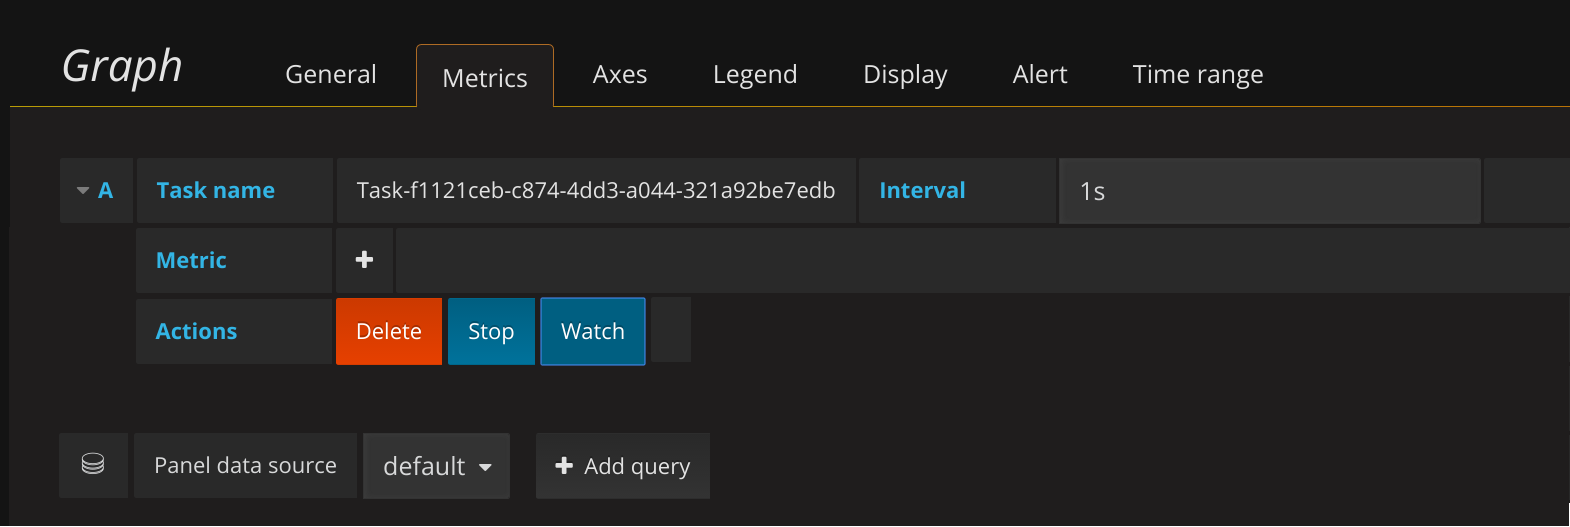
Add a new Dashboard.
Menu->Dashboards->NewCreate a new Graph dashboard. - Click on
“Panel Title”and edit. Select the task name and click“Watch”. - Note that the
“Task name”will be different. - Note that the
"Metric"field do not need to be entered (as it normal is in Grafana) as these are defined by the Intel SNAP task. Everything from that Task is streamed to Grafana live.
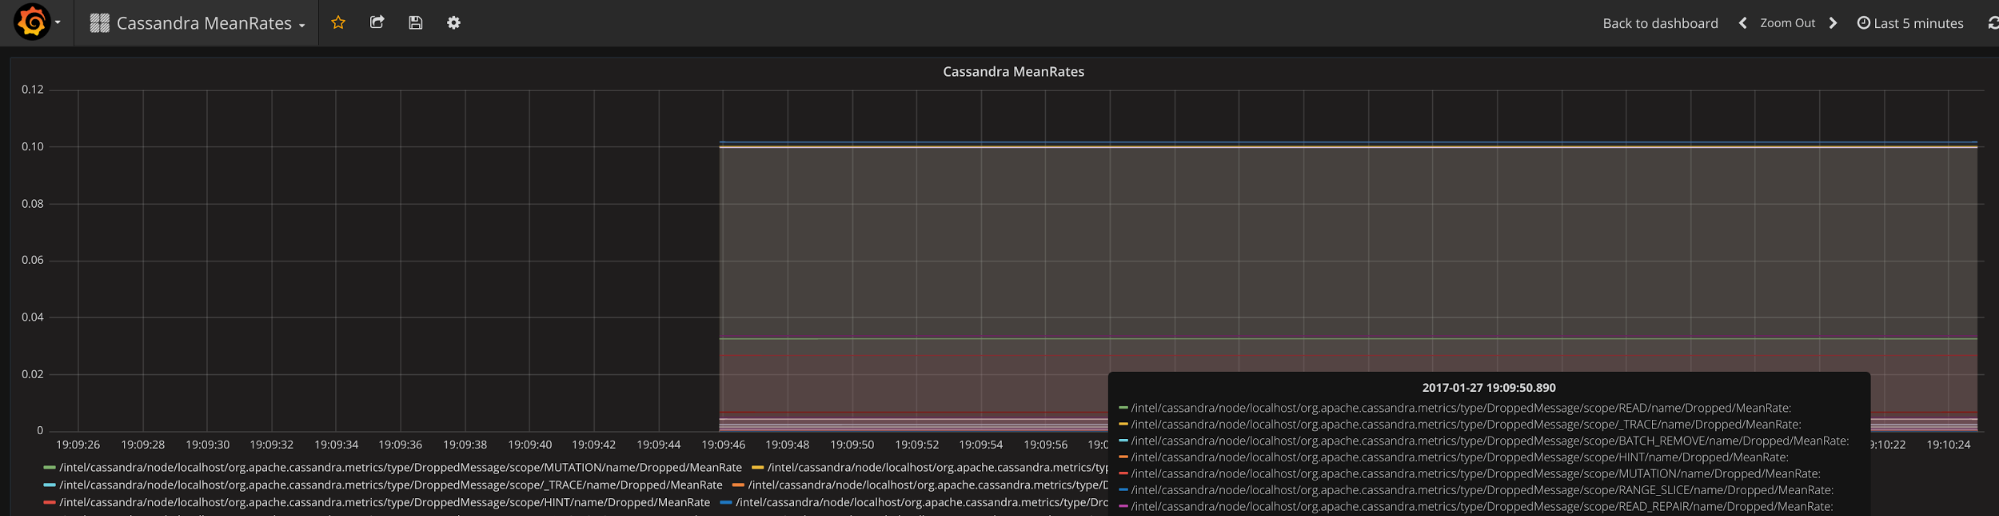
Grafana should now be graphing the various MeanRate metrics.
More information on using Snap DS within Grafana could be read here
A basic dashboard displaying the basic Intel Snap tasks described in the previous section can be downloaded here
Wrap up
Have fun with Intel Snap and watch it as a technology evolve.
If you’d like to know more about monitoring Cassandra in general check out our Alain’s awesome presentation from the last year’s Cassandra Summit 2016 conference.