![]()
Aaron Morton
Four Hours with Riemann
I recently found an afternoon to play with Riemann, something I’ve been wanting to do for a while. A lot of people have said nice things about it and it was time we got in on the action. One of the catalysts for action was the addition of configurable reporters for the Metrics library in Cassandra v2.0.2. If you’ve not heard about this head over to the DataStax blog and read the guest post by Chris Burroughs.
Going into this my understanding of Riemann was based on glancing at the web site and things I’d read on Twitter. I thought it would let me monitor Cassandra in real time, which it did. I thought it would be nice, which it was. I thought it would have more features than I could grasp in four hours, and it did.
Readying the Reporter
My plan was to use a Metrics reporter to push data from Cassandra to Riemann. A reporter collects metrics from the MetricRegistry and does something with them. Cassandra uses the JmxReporter to make the metrics available via JMX. Fortunately Kyle had created a Java library for Riemann that included a Metrics Reporter. The RiemannReporter collects metrics that match some rules and pushes them to the Riemann server. This removes one part from the deployment which is good. If the Cassandra server is running there is a good chance the metrics are being reported.
I was able to use the RiemannReporter without any changes. I simply built the target so I could add it to a local maven repository later.
mvn install
This creates:
target/riemann-java-client-0.2.9-SNAPSHOTtarget/maven-archiver/pom.properties
Later we will need to call RiemannReporter.enable() to start the reporter so it’s a good idea to take a look at that code now. It need a RiemannReporter.Config object that we build and supply when Cassandra starts the reporters.
Conflating the Configuration
Cassandra 2.0.2 adds the ability to start Metrics Reporters through a configuration file that drives the metrics-reporter-config library. The configuration file is specified on the command line when starting Cassandra using the cassandra.metricsReporterConfigFile parameter. For my example I added this to cassandra-env.sh:
JVM_OPTS="$JVM_OPTS -Dcassandra.metricsReporterConfigFile=my-metrics.yaml"
My my-metrics.yaml file was based on conf/metrics-reporter-config-sample.yaml that ships with Cassandra 2.0.2 and was placed in config/. Out of the box there is support for reporting to the console, csv, ganglia and graphite. All of these are fine choices but none of them will connect directly to Riemann. To use the RiemannReporter I needed to modify ReporterConfig to expose it as a property for snakeyaml to set. Currently the change is in our fork of metrics-reporter-config, we will get a PR sorted shortly.
I updated ReporterConfig to have a list of RiemannReporterConfig objects that both hold the config for the reporter and enable it. The config objects have a pretty simple life; they are created and populated by snakeyaml and called to construct and start the reporter.
To get the riemann-java-client into the metrics-reporter-config project I updated the maven pom.xml. First I added a local repository then I added a new dependency on the library:
<repositories>
  <repository>
    <id>my-local-repo</id>
    <url>file://${basedir}/repo/</url>
  </repository>
</repositories>
...
<dependencies>
  <dependency>
    <groupId>com.aphyr</groupId>
    <artifactId>riemann-java-client</artifactId>
    <version>0.2.9-SNAPSHOT</version>
  </dependency>
  ...
</dependencies>
I copied the jar and pom.properties file from above into the local repository as follows:
├── repo
│   └── com
│       └── aphyr
│           └── riemann-java-client
│               └── 0.2.9-SNAPSHOT
│                   ├── pom.properties
│                   └── riemann-java-client-0.2.9-SNAPSHOT.jar
I wanted to drop the changes into a stock Cassandra 2.0.2 bin distribution. So I build the jar and downloaded all the dependencies:
mvn install
mvn dependency:copy-dependencies
This created:
target/reporter-config-2.2.0-SNAPSHOT.jartarget/dependency/*.jar
I copied all the files to lib/ in the Cassandra distribution and removed the following from lib/ (mostly duplicated with versions Cassandra ships):
netty-3.6.1.Final.jarreporter-config-2.1.0.jarslf4j-api-1.7.5.jarsnakeyaml-1.12.jar
With those changes in place the next time I started Cassandra it would read my-metrics.yaml and start pushing metrics to the Riemann server. The configuration below sends metrics every second to localhost on TCP port 5555. I’ve asked for the thread pool, client request and column family metrics:
riemann:
  -
    period: 1
    timeunit: 'SECONDS'
    hosts:
      - host: 'localhost'
        port: 5555
    predicate:
      color: "white"
      useQualifiedName: true
      patterns:
        - "^org.apache.cassandra.metrics.ThreadPools.+"
        - "^org.apache.cassandra.metrics.ClientRequest.+"
        - "^org.apache.cassandra.metrics.ColumnFamily.Keyspace1.Standard1.+"
(I was planning to generate some load using cassandra-stress and wanted to see the write load on Standard1 Column Family it uses.)
Running with Riemann
Riemann has a good quick start guide that I used to get going. It’s worth a read, I’ve only listed the few commands I used. I could not start the latest Riemann 0.2.3 release on OSX but was able to get 0.2.2 working. The issue is being tracked on github for those playing along at home. To get the server running I downloaded the tar ball, unpacked it and ran bin/riemann etc/riemann.config.
aarons-MBP-2011:riemann-0.2.2 aaron$ bin/riemann etc/riemann.config
INFO [2013-11-18 20:19:38,688] main - riemann.bin - PID 11513
INFO [2013-11-18 20:19:38,826] clojure-agent-send-off-pool-4 - riemann.transport.tcp - TCP server 127.0.0.1 5555 online
INFO [2013-11-18 20:19:38,826] clojure-agent-send-off-pool-2 - riemann.transport.udp - UDP server 127.0.0.1 5555 16384 online
INFO [2013-11-18 20:19:38,826] clojure-agent-send-off-pool-0 - riemann.transport.websockets - Websockets server 127.0.0.1 5556 online
INFO [2013-11-18 20:19:38,829] main - riemann.core - Hyperspace core online
Note: If you edit etc/riemann.config and add the following to the end the server will log all events to the console, this can be useful when you are starting.
; print events to the log
(streams
        prn)
To get the dashboard running I installed the ruby client, tools and dashboard using:
gem install riemann-client riemann-tools riemann-dash
Then started the dashboard.
aarons-MBP-2011:riemann-0.2.3 aaron$ riemann-dash
No configuration loaded; using defaults.
== Sinatra/1.4.4 has taken the stage on 4567 for development with backup from Thin
Thin web server (v1.6.1 codename Death Proof)
Maximum connections set to 1024
Listening on localhost:4567, CTRL+C to stop
The quick start guide explains how to run a ping test program that creates some data to view in the dashboard.
Cranking with Cassandra
When everything works Cassandra will log the following during startup (after the log has replayed):
INFO 20:38:13,813 Startup completed! Now serving reads.
INFO 20:38:13,817 Trying to load metrics-reporter-config from file: my-metrics.yaml
INFO 20:38:13,856 Enabling RiemannReporter to localhost:5555
At this point Cassandra will be sending metrics to the Riemann server. If you added the verbose logging to the Riemann configuration you should see something like this:
#riemann.codec.Event{:host "aarons-MBP-2011.local", :service " org.apache.cassandra.metrics ThreadPools request.MutationStage ActiveTasks", :state nil, :description nil, :metric 0, :tags nil, :time 1384844560, :ttl nil}
#riemann.codec.Event{:host "aarons-MBP-2011.local", :service " org.apache.cassandra.metrics ThreadPools request.MutationStage CompletedTasks", :state nil, :description nil, :metric 89321, :tags nil, :time 1384844560, :ttl nil}
#riemann.codec.Event{:host "aarons-MBP-2011.local", :service " org.apache.cassandra.metrics ThreadPools request.MutationStage CurrentlyBlockedTasks", :state nil, :description nil, :metric 0, :tags nil, :time 1384844560, :ttl nil}
#riemann.codec.Event{:host "aarons-MBP-2011.local", :service " org.apache.cassandra.metrics ThreadPools request.MutationStage PendingTasks", :state nil, :description nil, :metric 0, :tags nil, :time 1384844560, :ttl nil}
#riemann.codec.Event{:host "aarons-MBP-2011.local", :service " org.apache.cassandra.metrics ThreadPools request.MutationStage TotalBlockedTasks", :state nil, :description nil, :metric 0, :tags nil, :time 1384844560, :ttl nil}
Dancing with Dashboards
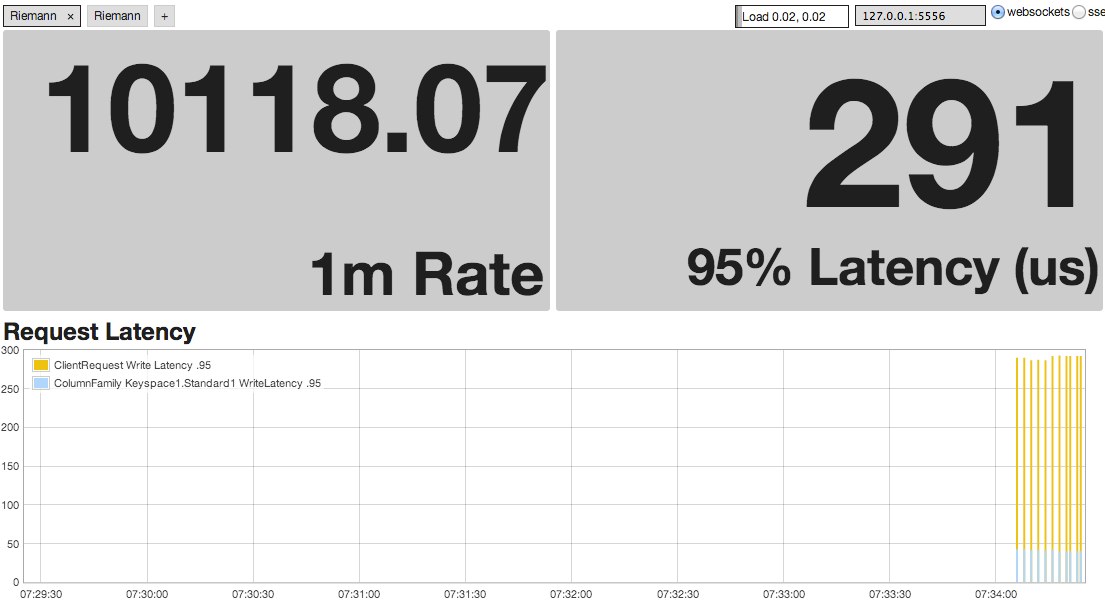
Starting out the dashboard in Riemann look underwhelming, but it soon becomes overwhelming when you realise the power it provides. After some trial and error I created a dashboard to show the:
- 1 minute average write throughput per second.
- 95th percentile write request latency in microseconds.
- rolling graph of the local write latency with the request latency stacked on top.
Using this simple layout.
To get the layout I selected the top tile in the example dashboard and split it using control+left arrow. This gave three tiles that I configured (select the tile and press “e”) as:
- Top Left
- Type: Gauge
- Title: 1m Rate
-
Query:
(service = “ org.apache.cassandra.metrics ClientRequest Write Latency”)
- Top Right
- Type: Gauge
- Title: 95% Latency (us)
-
Query:
(service = “ org.apache.cassandra.metrics ClientRequest Write Latency .95”)
- Bottom
- Type: Flot
- Title: Request Latency
- Graph Type: Bar
- Stack Mode: Normal
-
Query:
(service = “ org.apache.cassandra.metrics ColumnFamily Keyspace1.Standard1 WriteLatency .95”) or (service = “ org.apache.cassandra.metrics ClientRequest Write Latency .95”)
You can see a video of the dashboard updating in response to cassandra-stress here
This is simple but it has some really nice features. First it’s mucho fast and gives instant feedback on the latency and throughput. Second the graph makes it clear what is taking time to process the complete request. The pale blue at the bottom is the local write time which is usually less than 50us. This only measures the time the write thread spends updating the memtable and the secondary indexes. The larger yellow part of the line measures the complete request time which includes overhead, queue time and the time taken to update the commit log. This is the clearest illustration I’ve ever seen of the difference between nodetool proxyhistograms and nodetool cfhistograms. It’s exactly what I hoped Riemann would do.
Next Steps
There are a few more steps I need to do. First ask Kyle to upload the riemann-java-client to Maven Central so I can easily add it to the metrics-reporter-config. Then tidy up my hack job on metrics-reporter-config and send a Pull Request to Chris.
While that is going on it’s time to get better acquainted with the Riemann stream processing language.