![]()
Patricia Gorla
JMX Management over SOCKS Proxy
Connecting to Cassandra’s JMX service through firewalls can be tricky. JMX connects you through one port (7199 by default), and then opens up a dynamic port with the application. This makes remote JMX connections difficult to set up securely.
Connecting via SSH SOCKS PROXY
Fortunately, we can set up a SOCKS proxy connection using SSH.
The SOCKS proxy transmits TCP connections through the proxy server. This means that any request — HTTP or otherwise — is viewed as originating from the proxy server. It’s an effective way of bypassing the firewalls in place on a computer, as well as masking the origin of a request.
We can set up a connection with:
    $ ssh -vND 9999 remote_server
    OpenSSH_6.2p2, OSSLShim 0.9.8r 8 Dec 2011
    ...
    debug1: Entering interactive session.
-
-D [bind_address:]port: Direct remote traffic to this port on the local machine. -
-N: Set the connection up to be closeable by a Keyboard Interrupt. -
-v: Use verbose mode to check on exactly what traffic is being transmitted.
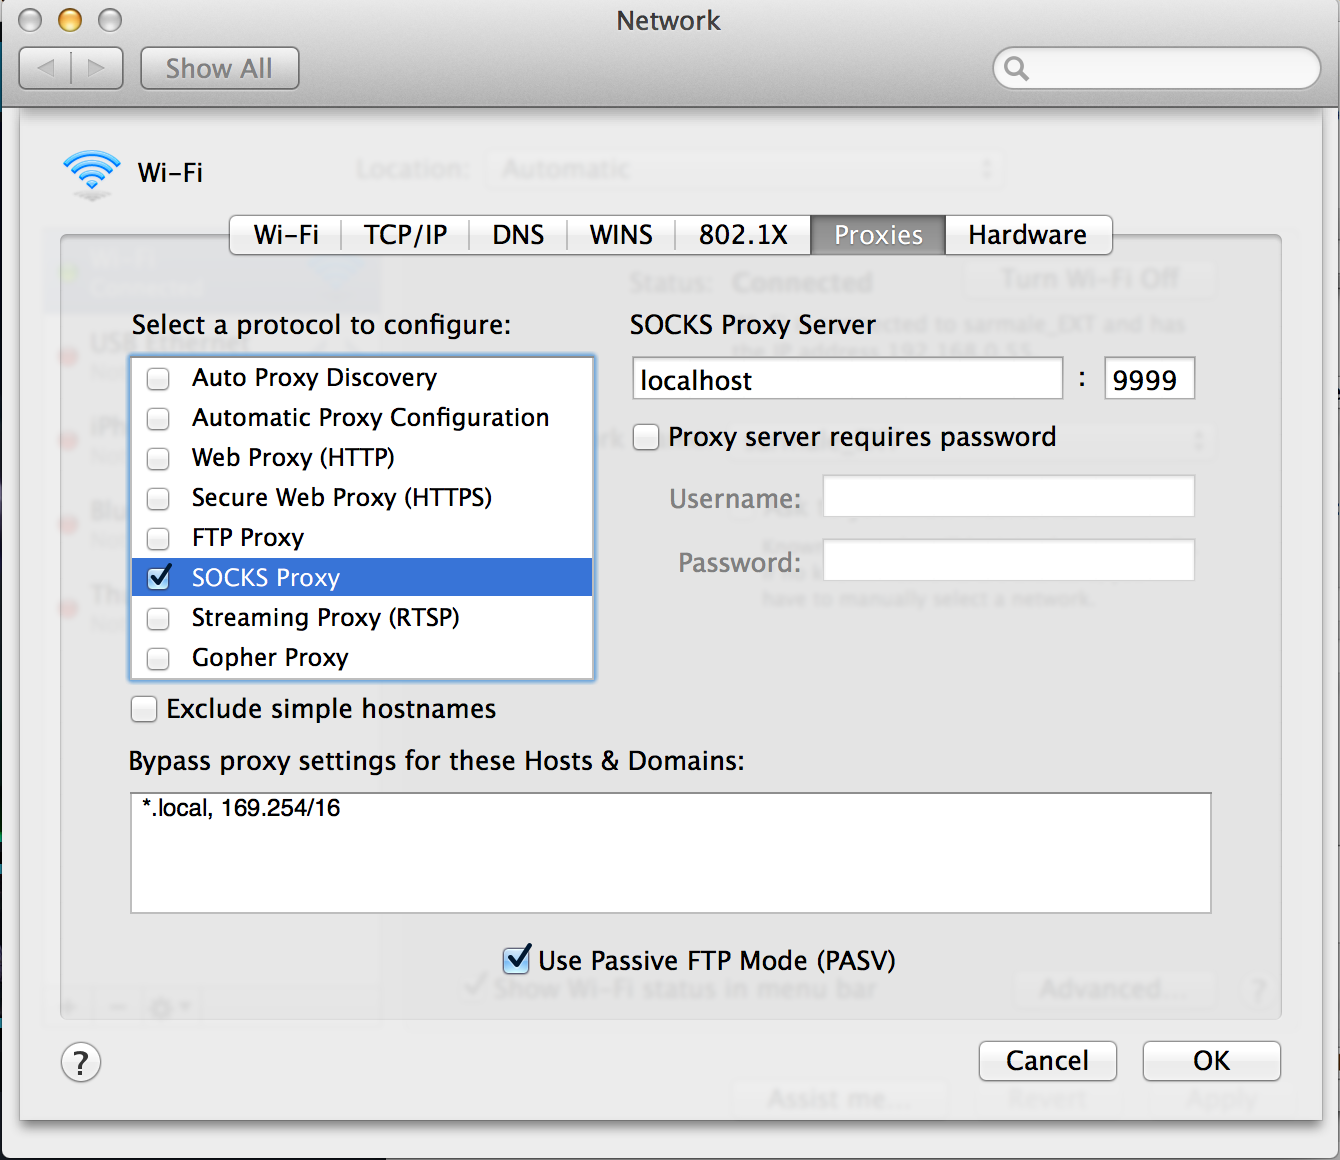
Now we need to set our system to connect via the proxy. On OS X, open up ‘System Preferences > Network > Advanced > Proxies’, and enable the SOCKS proxy on localhost:9999.
Security: Now you are connected to the remote server, and all network traffic will be routed through the proxy. Make sure to turn off any other applications — your browser, background apps — that use the network.
Most applications are set to automatically use your system’s proxy, though you can manually set them to not use a proxy.
Connecting to JConsole
Start jconsole and add ‘localhost:7199’ as a remote entry.
The screen will automatically populate with a list of running Java programs.
Click through to the CassandraDaemon view. The first five tabs — Overview, Memory, Threads, Classes, VM Summary — show Java runtime statistics, while the last tab, MBeans, give access into the running application.
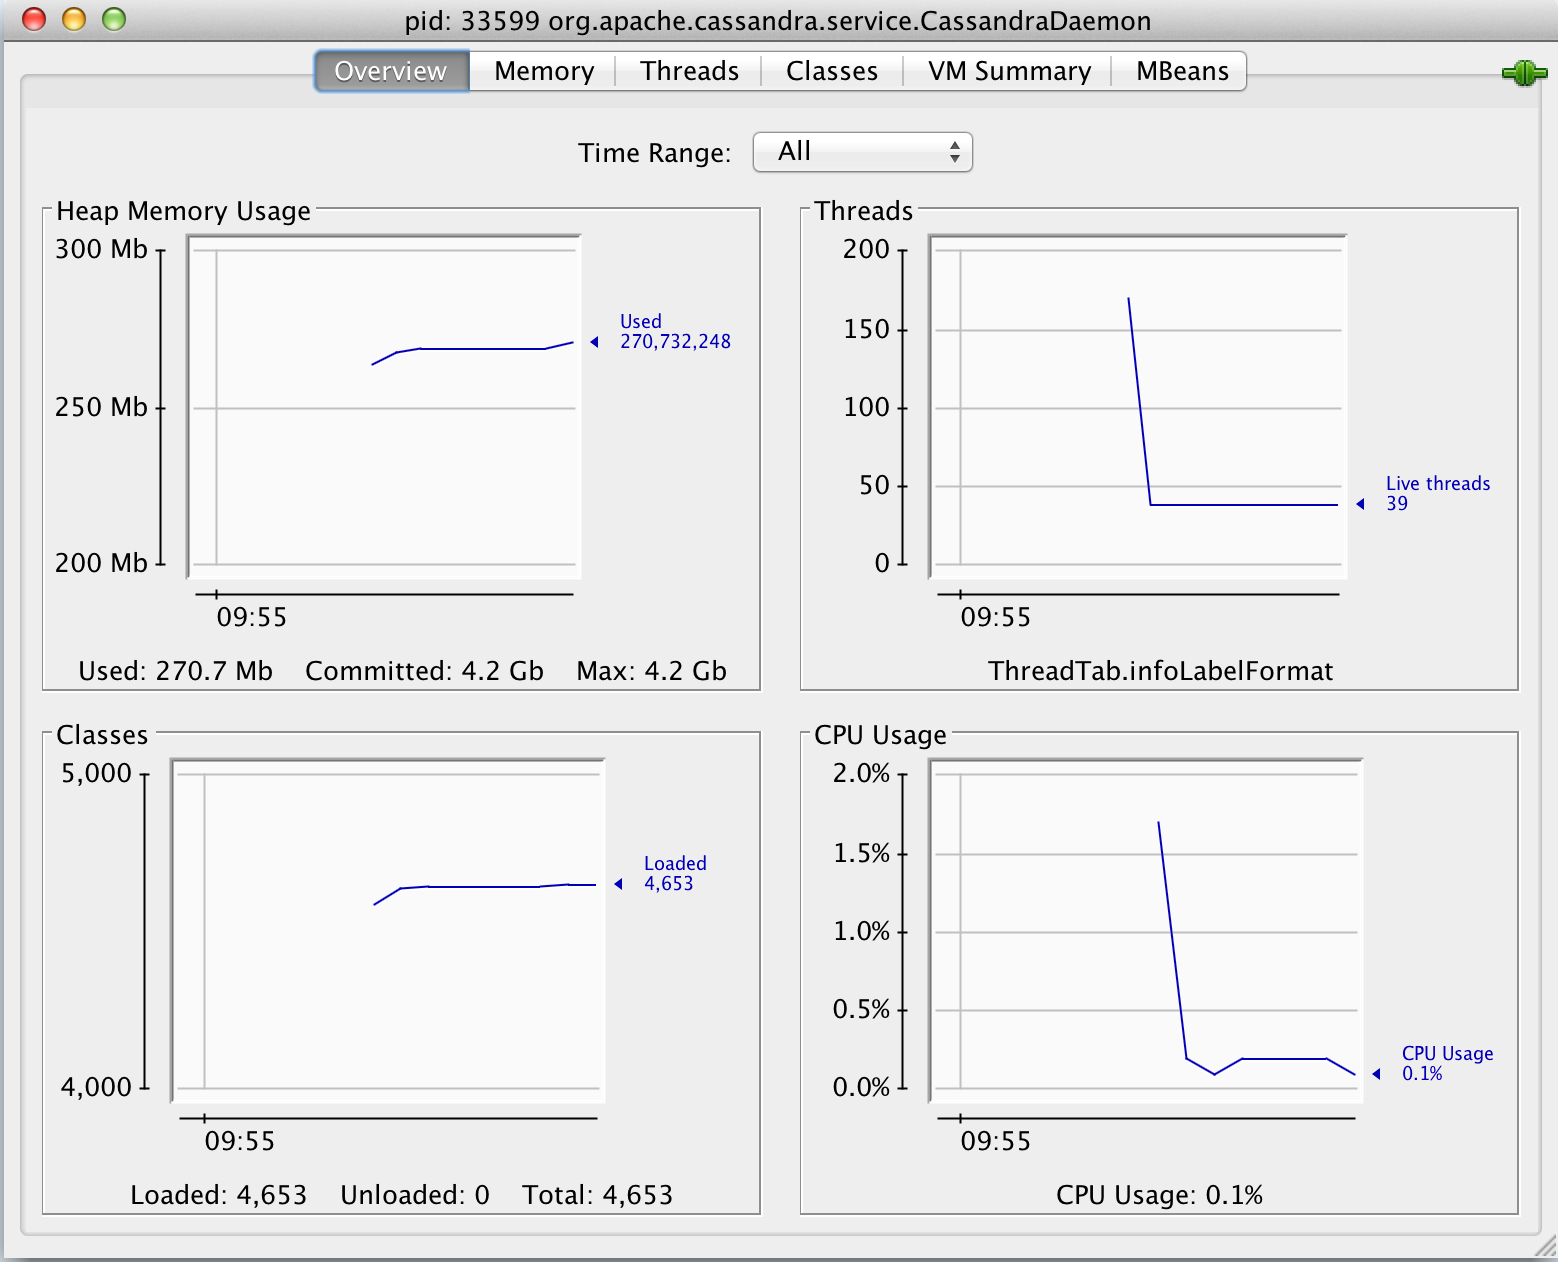
The Memory tab gives a purview into the health of the JVM. You can review the different memory pool generations, and heap and non-heap usage.
Threads and Classes both offer glimpses into their namesakes, while VM Summary gives a dated report on the state of the JVM. This is useful for collecting system overviews.
Finally, the MBeans tab offers tooling and insight into Cassandra.
You’re now connected to Cassandra, and can change the values while the process is running. Make sure to monitor the logs for any anomalies while updating the configuration.