![]()
Mick Semb Wever
Visualising Cassandra traces using Zipkin
Last year I presented at the Cassandra Summit on replacing Cassandra internal tracing system with Zipkin. That contribution has since been accepted and is now available in Cassandra-3.4.
Along with the work in updating the Zipkin Cassandra plugin, a Zipkin developer Adrian Cole has implemented the improvement so that Zipkin can trace itself. That a tracing tool can trace itself is so incredibly cool. These traces follow the CQL requests into the Cassandra cluster that’s used behind Zipkin. In a tool like Zipkin that supports different storage backends not every developer involved in Zipkin will understand CQL, or even just NoSQL. Self tracing here provides a visibility to the storage mechanism that helps developers become familiar and learn Cassandra, without having to read the manual. Self tracing will of course also help ensure Zipkin remains performant.
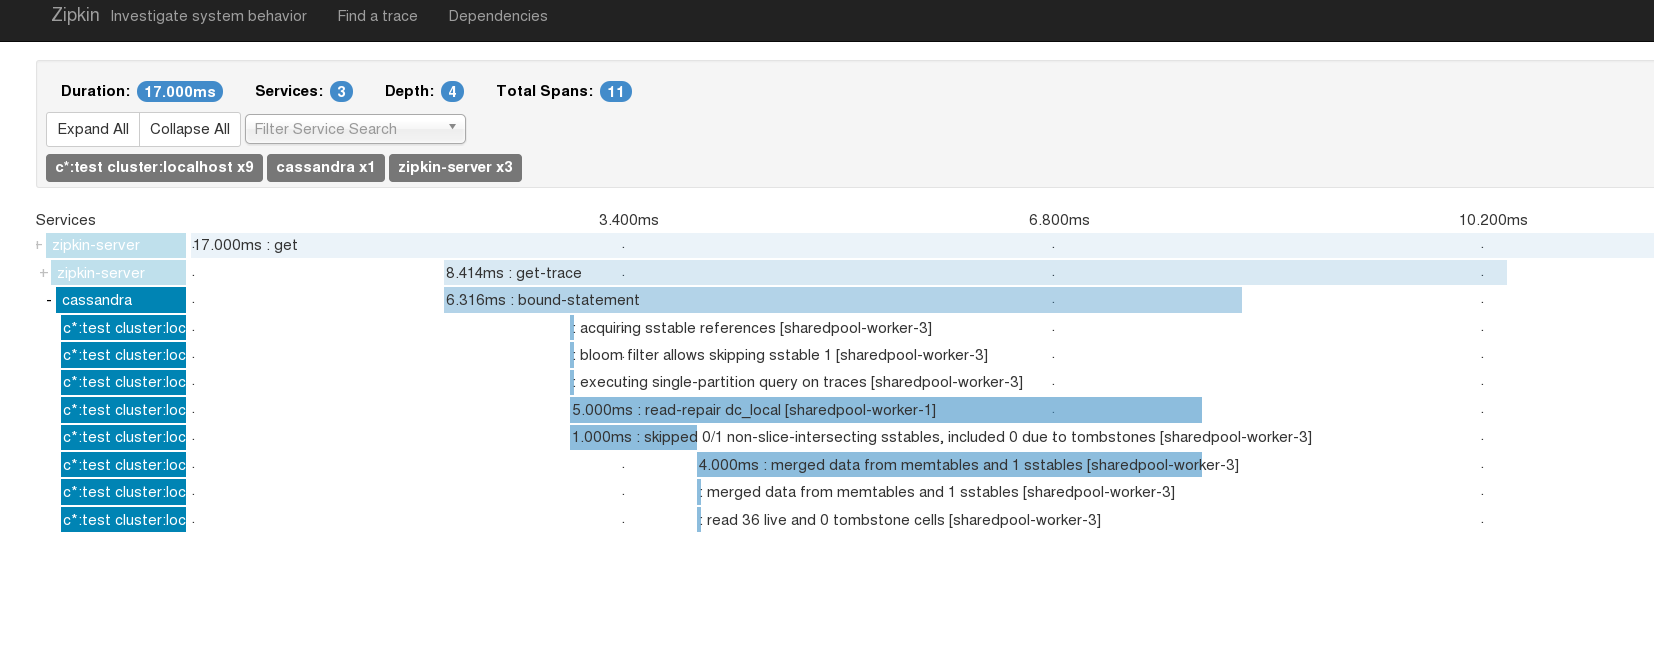
After Adrian finished the work I took a stab at looking at some of the results. One of the interesting screenshots I came up with was the one below. The CQL SELECT statement trace below highlights the actions of the Read Repair component Cassandra uses to enforce Eventual Consistency. The span in the trace below labeled read-repair dc-local shows the time spent in the background to check for inconsistencies.
This type of insight visualises plenty of interesting actions that happen internally, along with being able to identify quickly when Cassandra is not doing what you expect it to be doing.
If you’d like more on this, see my talk at ApacheCon BigData in Vancouver next week.