![]()
Mick Semb Wever
Observability in Apache Cassandra 4.0 with Event Diagnostics
Several new observability features will be part of the next major Apache Cassandra 4.0 release. We covered virtual tables in an earlier blog post and now would like to give a preview of another new feature, Diagnostic Events, which provide real time insight into your Cassandra internals.
Observability is key to successfully operating Apache Cassandra, as it allows users and developers to find bugs and identify runtime issues. Log files and metrics are a very popular way to get insights into a cluster’s behaviour, but they are limited to small text representations or time series data. Often important information is missing from log files and can’t be added without changing the source code and rebuilding Cassandra. In addition, log text output is tailored to be readable by humans and is not designed to be machine readable without creating custom parsers.
Diagnostic Events have been designed to fill this gap by providing a way to observe all different types of changes that occur inside Cassandra as they happen. For example, testing frameworks can subscribe listeners that will block the server when change events happen, thus providing a continuous evaluation of invariants across testing scenarios and environments. While other observability tools could subscribe listeners without blocking the Cassandra server, providing third parties visibility into how Cassandra navigates a variety of changes and critical information about your cluster.
The idea of Event Diagnostics was first proposed in 2016 by Stefan Podwinksi and then implemented as part of CASSANDRA-12944.
Types of Diagnostic Events
Currently the types of observability implemented by Event Diagnostics are:
- AuditEvents, capturing all audit log entries
- BootstrapEvents, when a new node is bootstrapping into a cluster
- GossiperEvents, state changes that are announced over gossip
- HintEvents, the storage and delivery of hints
- TokenMetadataEventsPendingRangeCalculatorServiceEvents, lifecycle changes and tasks when token ownership ranges are being calculated
- ReadRepairEvents and PartitionRepairEvents, different types of repair events
- SchemaAnnouncementEvents, schema changes proposed, received, and accepted
- SchemaMigrationEvents, schema propagation across a cluster
- SchemaEvents, high-level schema changes
- TokenAllocatorEvents, allocation of token range ownerships, random or via an allocation strategy.
A little about the implementation
Diagnostic Events have been implemented with a JMX interface consisting of two MBeans: the DiagnosticEventService and the LastEventIdBroadcaster. The DiagnosticEventService provides methods to enable diagnostics on a per event type and to bulk read new events. The LastEventIdBroadcaster provides attributes for the last published offsets for each event type. Importanlty, the LastEventIdBroadcaster avoids the use of JMX notifications, a mechanism that too easily loses events, by maintaining an offset for each event type’s queue. Behind these JMX interfaces the persistence of events is regulated by DiagnosticEventStore and although an in-memory store is currently used, an implementation based on Chronicle Queue is planned.
Monitoring Cassandra Diagnostic Events
Reaper is one of the tools that has the ability to listen to and display Cassandra’s emitted Diagnostic Events in real time. The following section outlines how to implement this feature and gain better visiblity into your cluster.
Enabling Diagnostic Events server-side in Apache Cassandra 4.0
Diagnostic Events are not enabled (published) by default in Apache Cassandra version 4.0, but can be manually enabled. To activate the publishing of diagnostic events, enable the diagnostic_events_enabled flag on the Cassandra node:
# Diagnostic Events #
# If enabled, diagnostic events can be helpful for troubleshooting operational issues. Emitted events contain details
# on internal state and temporal relationships across events, accessible by clients via JMX.
diagnostic_events_enabled: true
Restarting the node is required after this change.
Using Reaper to display Event Diagnostics
In Reaper go to the “Live Diagnostics” page.
Select the cluster that is running Cassandra version 4.0 with diagnostic_events_enabled: true, using the “Filter cluster” field.
Expand the “Add Events Subscription” section and type in a description for the subscription to be created.
Select the node whose diagnostic events you want to observe and select the diagnostic events you want to observe. Check “Enable Live View”.
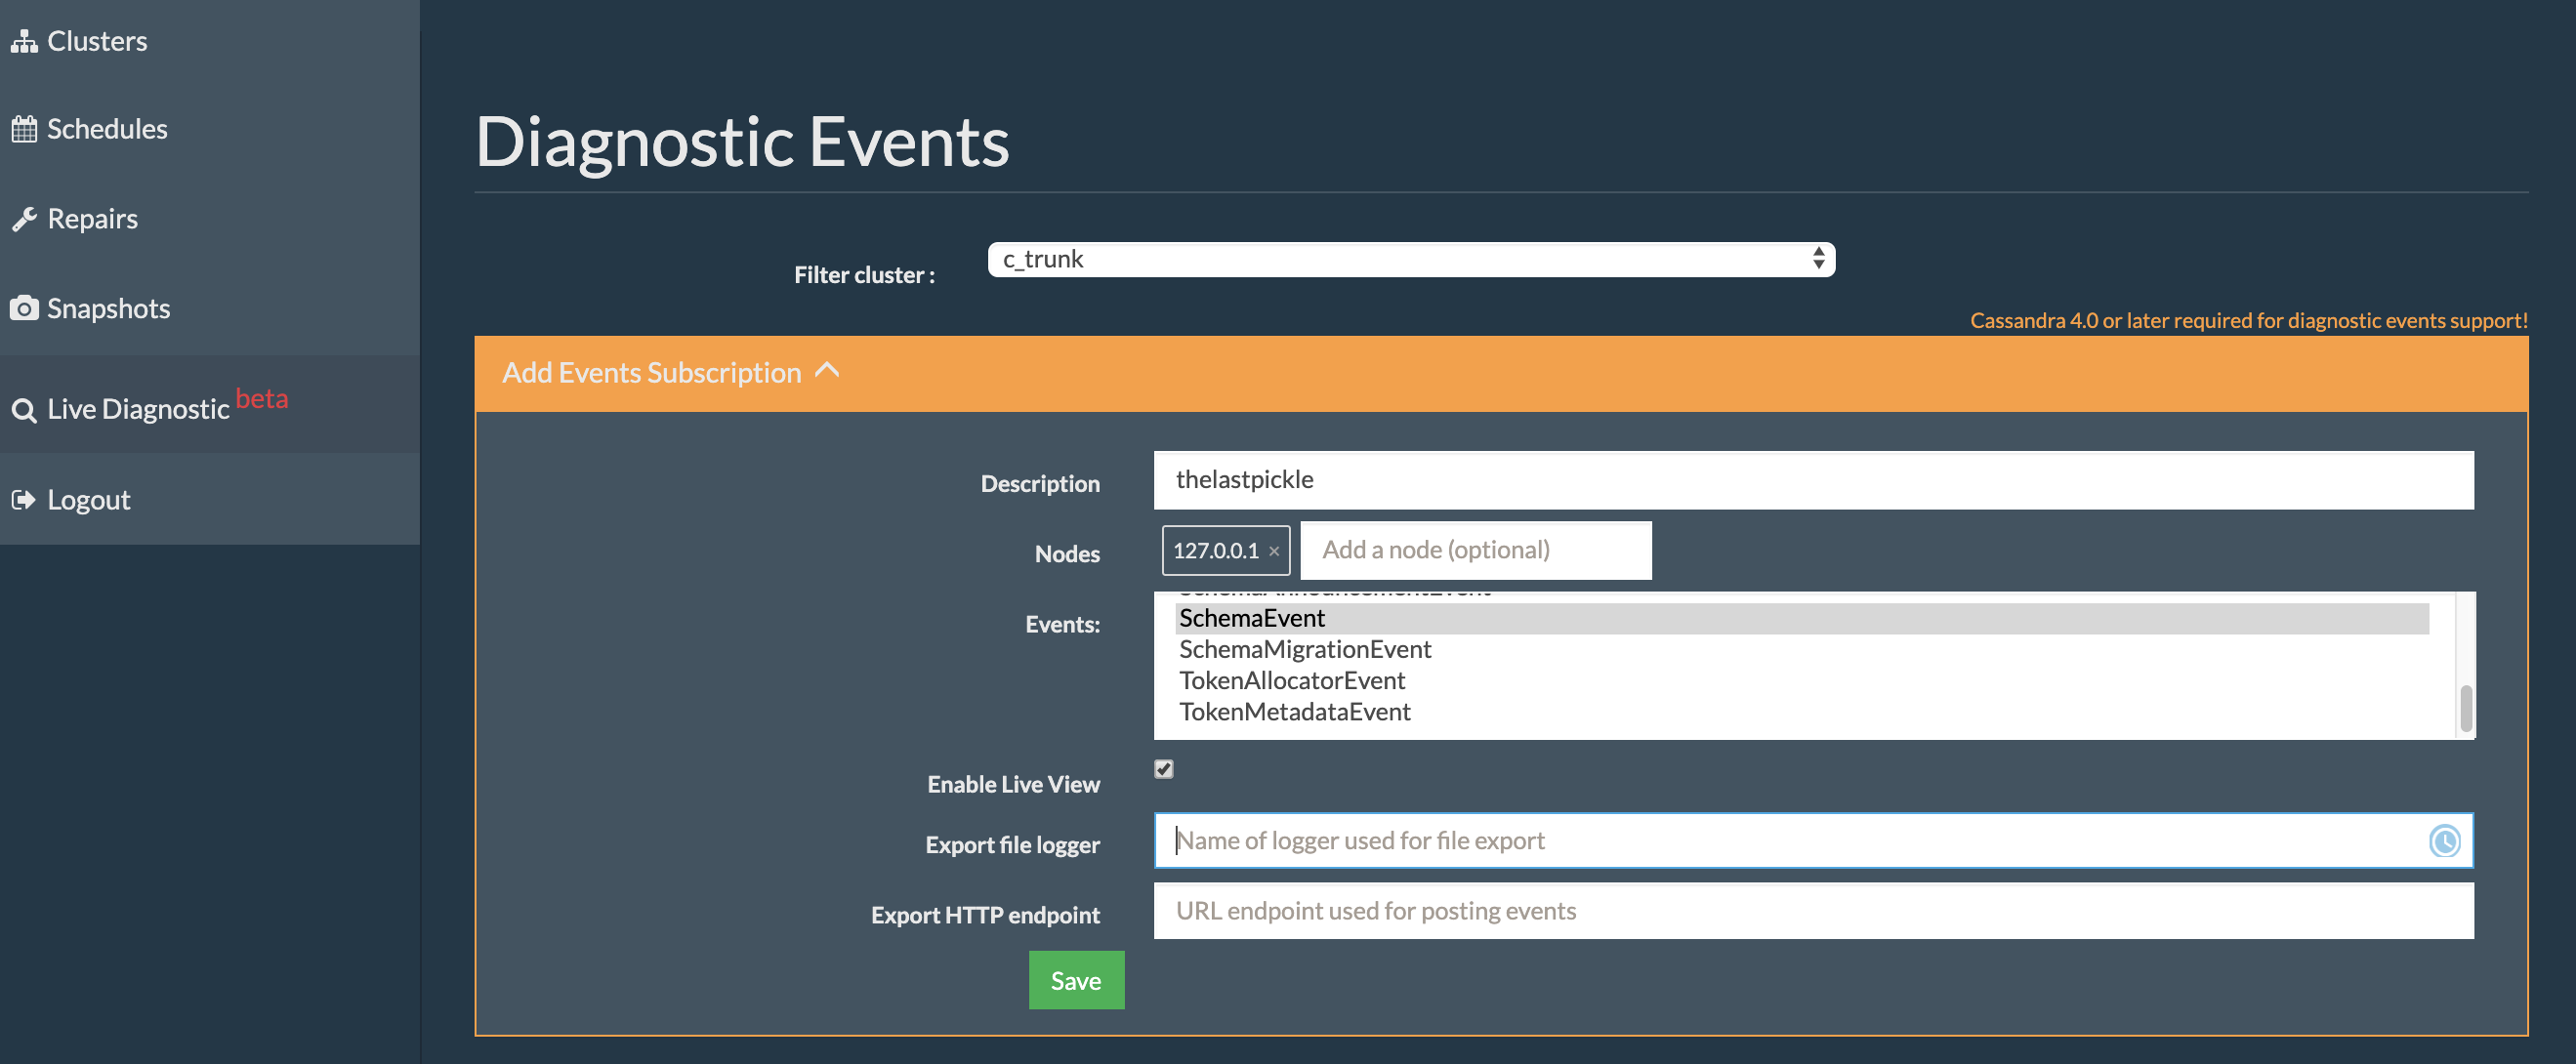
Press “Save”. In the list of subscriptions there should now be a row that displays the information entered above.
Press “View”. A green bar will appear. Underneath this green bar the types of diagnostic events selected and the nodes subscribed to will be displayed. Press the green bar to stop showing live events.
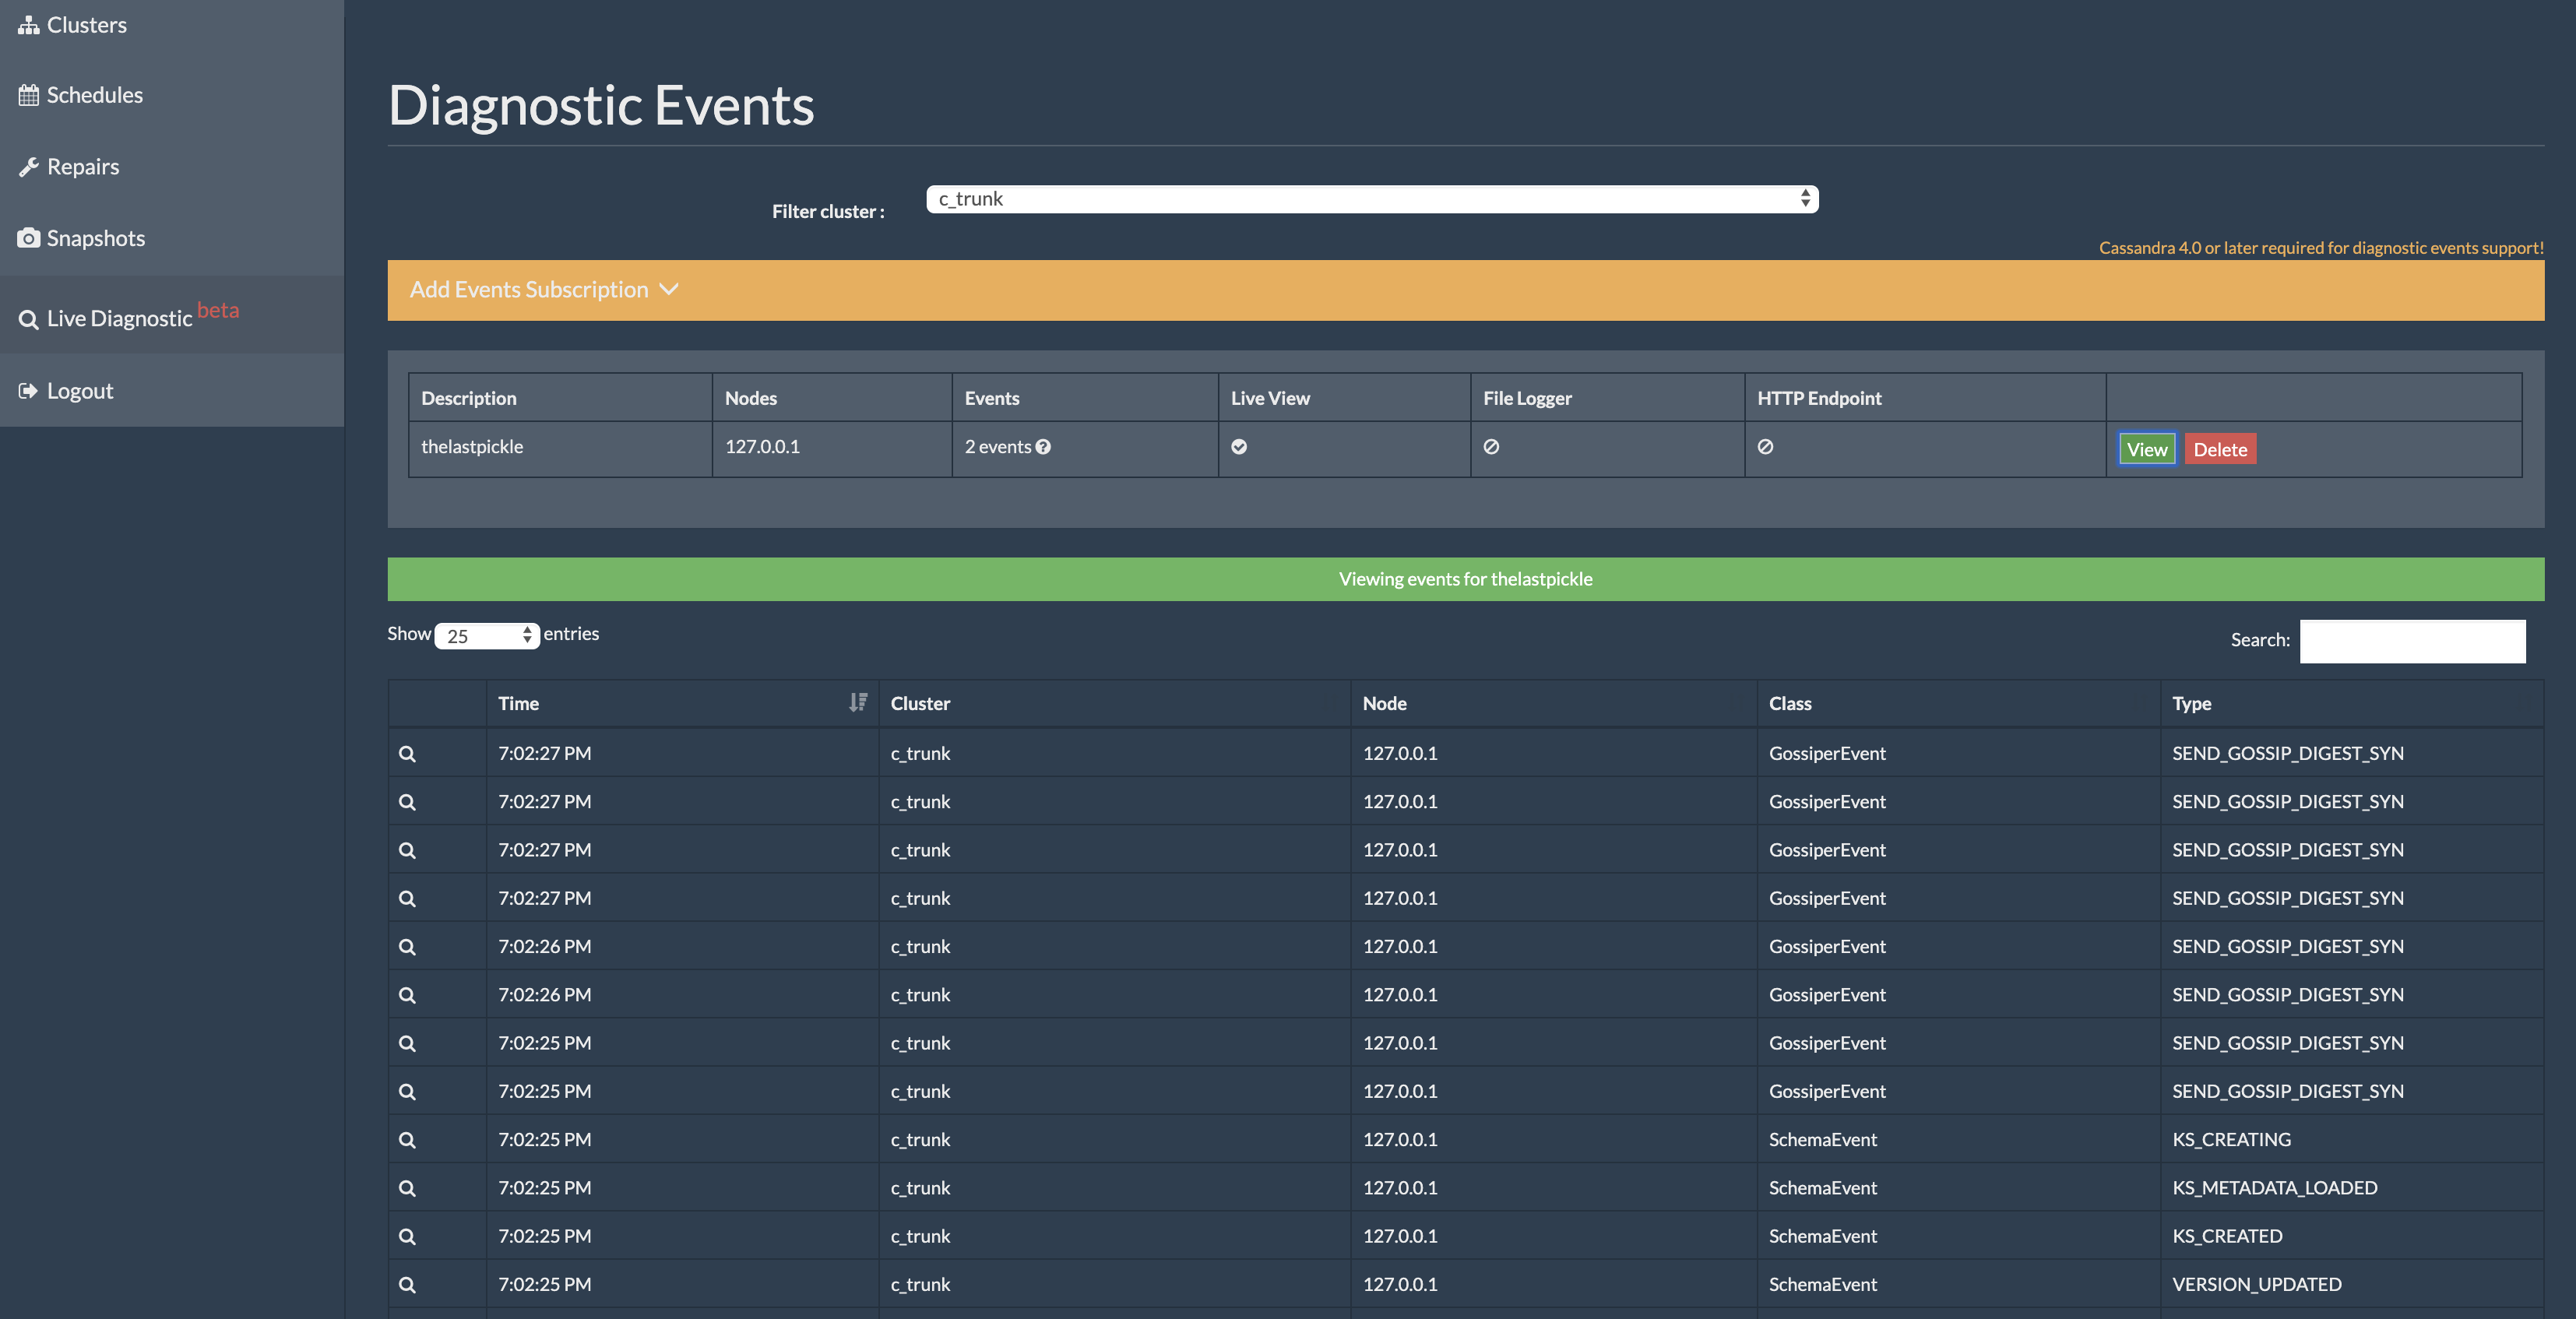
Event subscriptions is a way to understand what goes on inside Apache Cassandra, particularly at the cluster coordination level. Enabling Diagnostic Events has no performance overhead on the Cassandra node until subscriptions are also enabled. Reaper’s subscription may not be able to keep up and receive all events when traffic or load is significantly high on the Cassandra node as it keeps the event subscriptions in a fifo in-memory queue, of maximum length 200 per event type. The AuditEvent type can impose additional overhead on a cluster, and for that reason requires additional configuration in the auditing section of Cassandra’s yaml configuration file.
Happy diagnosing, hope you have some fun with this extra real-time insight into Cassandra internals. And if you would like to see more diagnostic event types added reach out, make your suggestions, and even better throw us a patch and get the ball rolling…