![]()
Mick Semb Wever
Wide Partitions in Apache Cassandra 3.11
This article was originally published on Backblaze.
Wide Partitions in Cassandra can put tremendous pressure on the java heap and garbage collector, impact read latencies, and can cause issues ranging from load shedding and dropped messages to crashed and downed nodes.
While the theoretical limit on the number of cells per Partition has always been two billion cells, the reality has been quite different, as the impacts of heap pressure show. To mitigate these problems, the community has offered a standard recommendation for Cassandra users to keep Partitions under 400MB, and preferably under 100MB.
However, in version 3 many improvements were made that affected how Cassandra handles wide Partitions. Memtables, caches, and SSTable components were moved off-heap, the storage engine was rewritten in CASSANDRA-8099 and Robert Stupp made a number of other improvements listed under CASSANDRA-11206.
Working with Backblaze and operating a Cassandra version 3.11 cluster we had the opportunity to test and validate how Cassandra actually handles Partitions with this latest version. We will demonstrate that well designed data models can go beyond the existing 400MB recommendation without nodes crashing through heap pressure.
Below, we walk through how Cassandra writes Partitions to disk in 3.11, look at how wide Partitions impact read latencies, and then present our testing and verification of wide Partition impacts on the cluster, using the work we did with Backblaze.
The Art and Science of Writing Wide Partitions to Disk
First we need to understand what a Partition is and how Cassandra writes Partitions to disk in version 3.11.
Each SSTable contain a set of files, and the (–Data.db) file contains numerous Partitions.
The layout of a Partition in the –Data.db file has three components: a header, followed by zero or one static rows, which is followed by zero or more ordered Clusterable objects. The Clusterable object in this file may either be a Row or a RangeTombstone that deletes data with each wide Partition containing many Clusterable objects. For an excellent in-depth examination of this, see Aaron’s blog post on the Cassandra 3.x Storage Engine.
The –Index.db file stores offsets for the Partitions, as well as the IndexInfo serialized objects for each Partition. These indices facilitate locating the data on disk within the –Data.db file. Stored Partition offsets are represented by a subclass of the RowIndexEntry.
This subclass is chosen by the the ColumnIndex and depends on the size of the partition:
-
RowIndexEntryis used when there are no Clusterable objects in the Partition, such as when there is only a static Row. In this case there are noIndexInfoobjects to store and so the parentRowIndexEntryclass is used rather than a subclass. -
The
IndexEntrysubclass holds theIndexInfoobjects in memory until the Partition has finished writing to disk. It is used in for Partitions where the total serialized size of theIndexInfoobjects is less than thecolumn_index_cache_size_in_kbconfiguration setting (which defaults to 2KB). -
The
ShallowIndexEntrysubclass serializesIndexInfoobjects to disk as they are created and references these objects using only their position in the file. This is used in Partitions where the total serialized size of theIndexInfoobjects is more than thecolumn_index_cache_size_in_kbconfiguration setting.
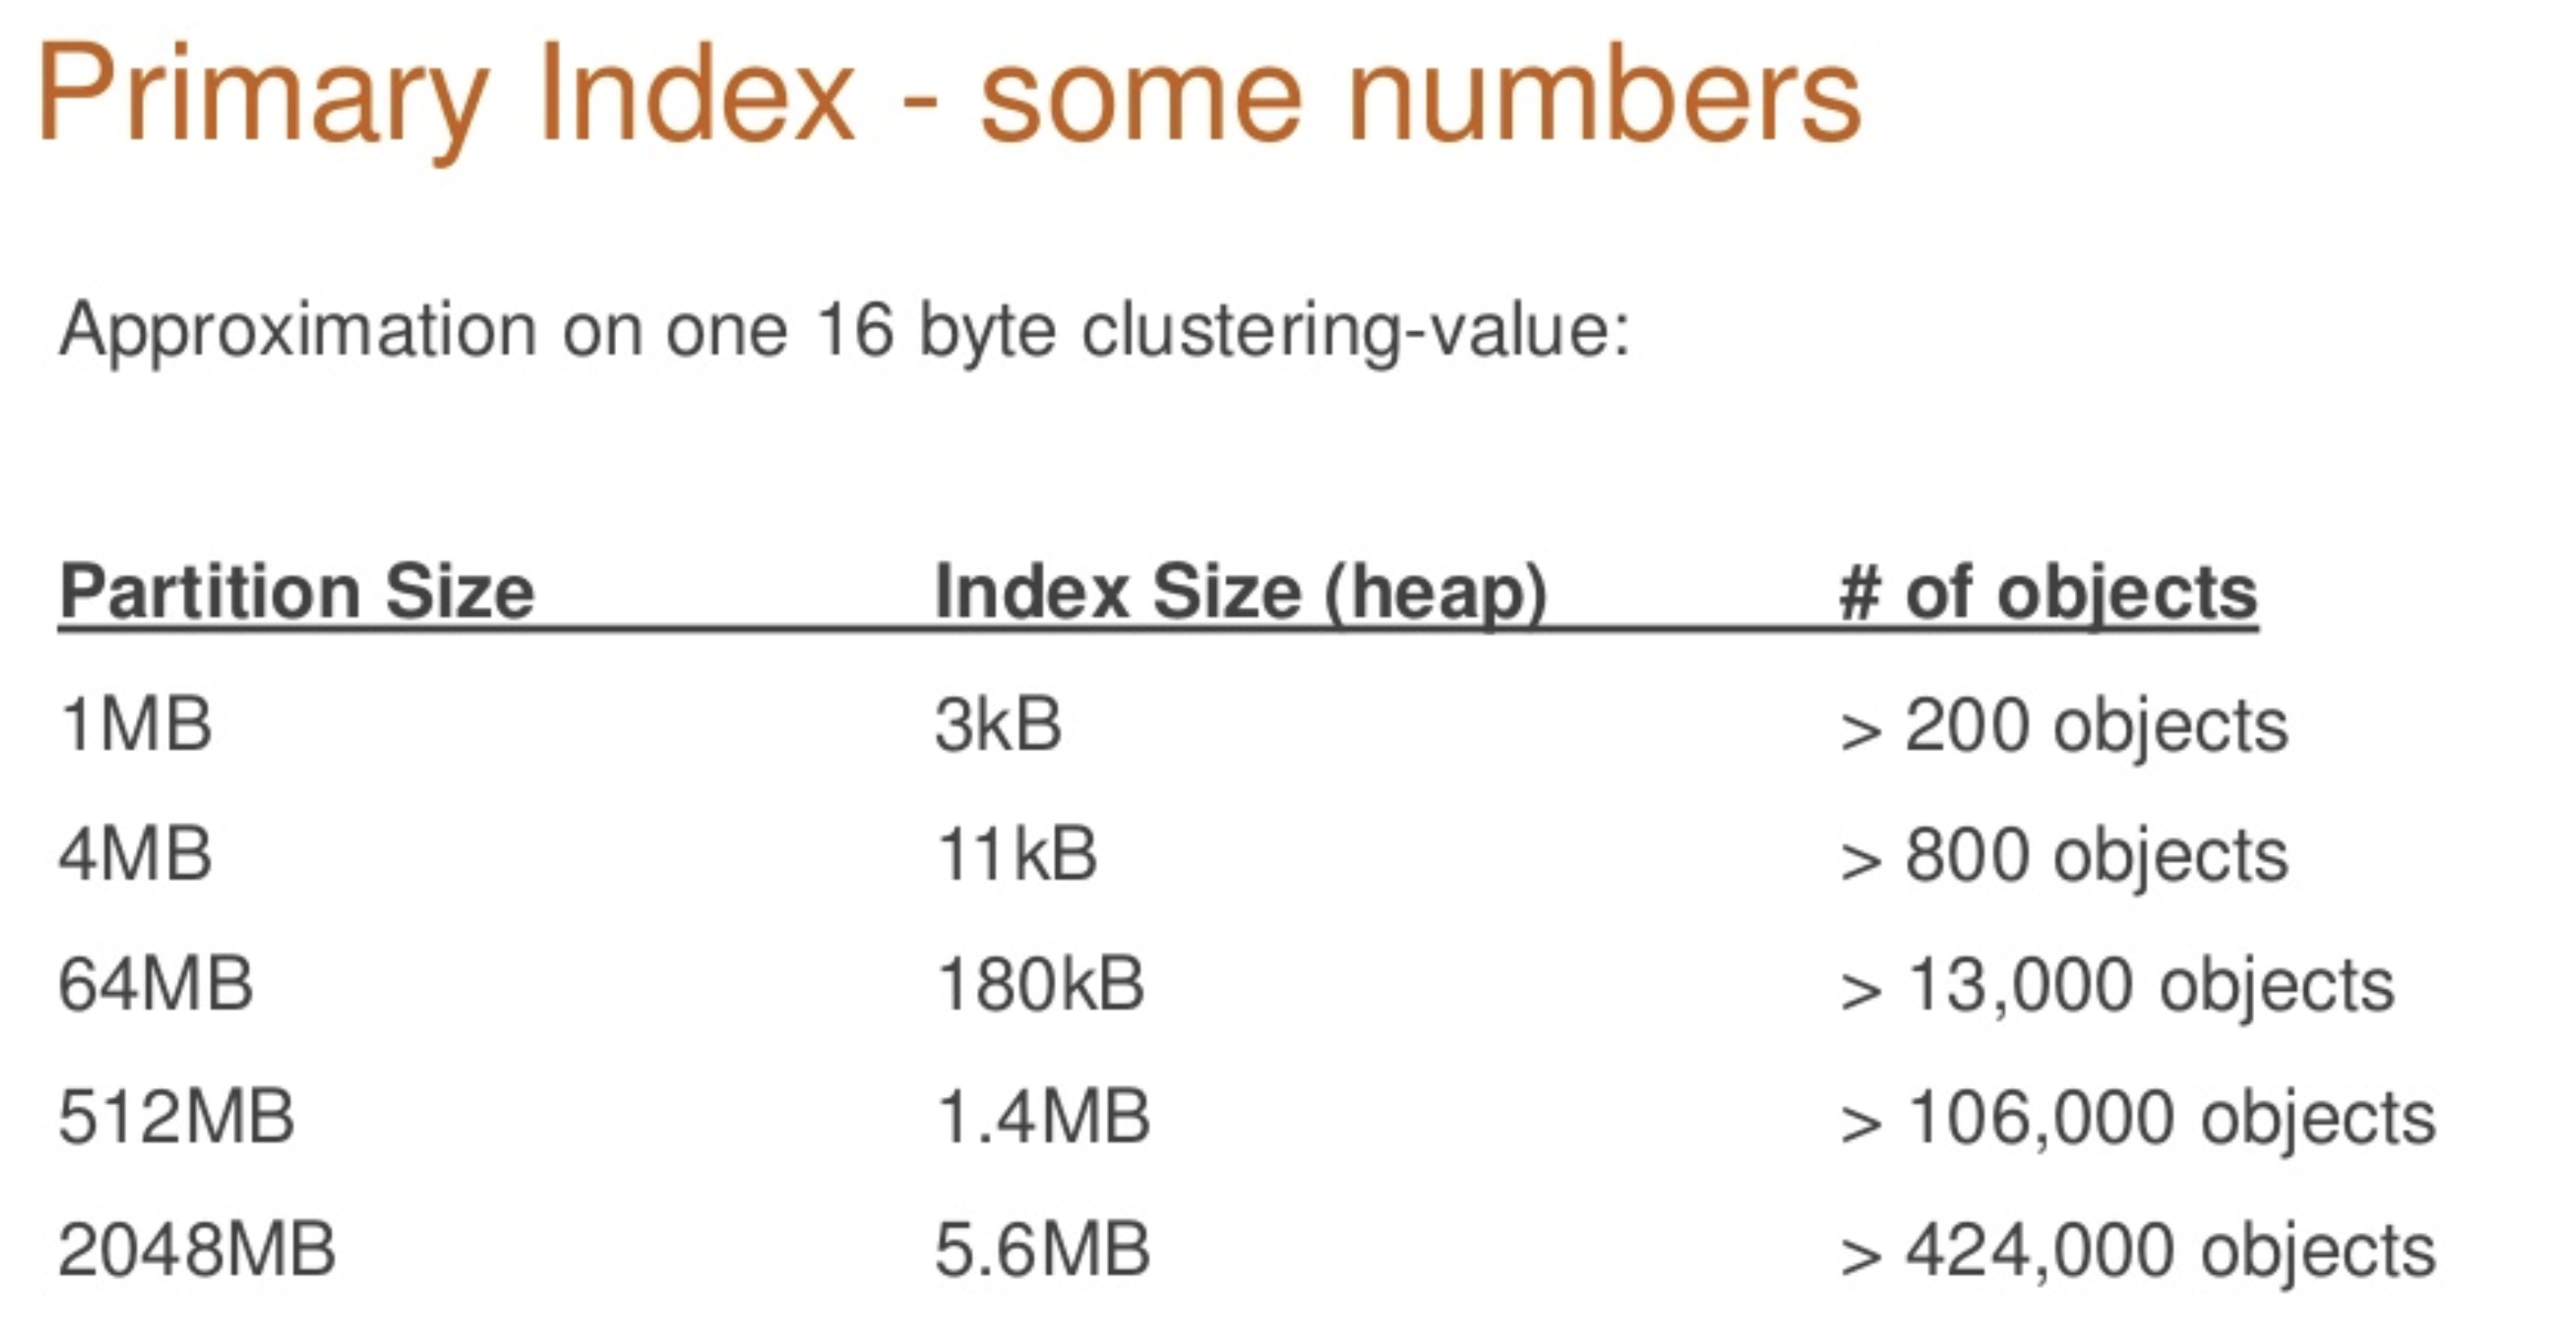
These IndexInfo objects provide a sampling of positional offsets for Rows within a Partition, creating an index. Each object specifies the offset the page starts at, the first Row and the last Row.
So, in general, the bigger the Partition, the more IndexInfo objects need to be created when writing to disk - and if they are held in memory until the Partition is fully written to disk they can cause memory pressure. This is why the column_index_cache_size_in_kb setting was added in Cassandra 3.6 and the objects are now serialized as they are created.
The relationship betweeen Partition size and the number of objects was quantified by Robert Stupp in his presentation, Myths of Big Partitions:
How Wide Partitions Impact Read Latencies
Cassandra’s key cache is an optimization that is enabled by default and helps to improve the speed and efficiency of the read path by reducing the amount of disk activity per read.
Each key cache entry is identified by a combination of the keyspace, table name, SSTable, and the Partition key. The value of the key cache is a RowIndexEntry or one of its subclasses - either IndexedEntry or the new ShallowIndexedEntry. The size of the key cache is limited by the key_cache_size_in_mb configuration setting.
When a read operation in the storage engine gets a cache hit it avoids having to access the –Summary.db and –Index.db SSTable components, which reduces that read request’s latency. Wide Partitions, however, can decrease the efficiency of this key cache optimization because fewer hot Partitions will fit into the allocated cache size.
Indeed, before the ShallowIndexedEntry was added in Cassandra version 3.6, a single wide Row could fill the key cache, reducing the hit rate efficiency. When applied to multiple Rows, this will cause greater churn of additions and evictions of cache entries.
For example, if the IndexEntry for a 512MB Partition contains 100K+ IndexInfo objects and if these IndexInfo objects total 1.4MB, then the key cache would only be able to hold 140 entries.
The introduction of ShallowIndexedEntry objects changed how the key cache can hold data. The ShallowIndexedEntry contains a list of file pointers referencing the serialized IndexInfo objects and can binary search through this list, rather than having to deserialize the entire IndexInfo objects list. Thus when the ShallowIndexedEntry is used no IndexInfo objects exist within the key cache. This increases the storage efficiency of the key cache in storing more entries, but does still require that the IndexInfo objects are binary searched and deserialized from the –Index.db file on a cache hit.
In short, on wide Partitions a key cache miss still results in two additional disk reads, as it did before Cassandra 3.6, but now a key cache hit incurs a disk read to the -Index.db file where it did not before Cassandra 3.6.
Object Creation and Heap Behavior with Wide Partitions in 2.2.13 vs 3.11.3
Introducing the ShallowIndexedEntry into Cassandra version 3.6 creates a measurable improvement in the performance of wide Partitions. To test the effects of this and the other performance enhancement features introduced in version 3 we compared how Cassandra 2.2.13 and 3.11.3 performed when inserting one hundred thousand, one million, or ten million Rows were each written to a single Partition.
The results and accompanying screenshots help illustrate the impact of object creation and heap behavior when inserting Rows into wide Partitions. While version 2.2.13 crashed repeatedly during this test, 3.11.3 was able to write over 30 million Rows to a single Partition before Cassandra Out-of-Memory crashed. The test and results are reproduced below.
Both Cassandra versions were started as single-node clusters with default configurations, excepting heap customization in the cassandra–env.sh:
    MAX_HEAP_SIZE="1G"
    HEAP_NEWSIZE="600M"
In Cassandra only the configured concurrency of memtable flushes and compactors determines how many Partitions are processed by a node and thus pressuring its heap at any one time. Based on this known concurrency limitation, profiling can be done by inserting data into one Partition against one Cassandra node with a small heap. These results extrapolate to production environments.
The tlp-stress tool inserted data in three separate profiling passes against both versions of Cassandra, creating wide Partitions of one hundred thousand (100K), one million (1M), or ten million (10M) Rows.
A tlp-stress profile for wide Partitions was written, as no suitable profile existed. The read to write ratio used the default setting of 1:100.
The following command lines then implemented the tlp-stress tool:
# To write 100000 rows into one partition
tlp-stress run Wide --replication "{'class':'SimpleStrategy','replication_factor': 1}" -n 100K

# To write 1M rows into one partition
tlp-stress run Wide --replication "{'class':'SimpleStrategy','replication_factor': 1}" -n 1M

# To write 10M rows into one partition
tlp-stress run Wide --replication "{'class':'SimpleStrategy','replication_factor': 1}" -n 10M
Each time tlp-stress executed it was immediately followed by a command to ensure the full count of specified Rows passed through the memtable flush and were written to disk:
nodetool flush
The graphs in the sections below, taken from the Apache NetBeans Profiler, illustrate how the ShallowIndexEntry in Cassandra version 3.11 avoids keeping IndexInfo objects in memory.
Notably, the IndexInfo objects are instantiated far more often, but are referenced for much shorter periods of time. The Garbage Collector is more effective at removing short-lived objects, as illustrated by the GC pause times being barely present in the Cassandra 3.11 graphs compared to Cassandra 2.2 where GC pause times overwhelm the JVM.
Wide Partitions in Cassandra 2.2
Benchmarks were against Cassandra 2.2.13
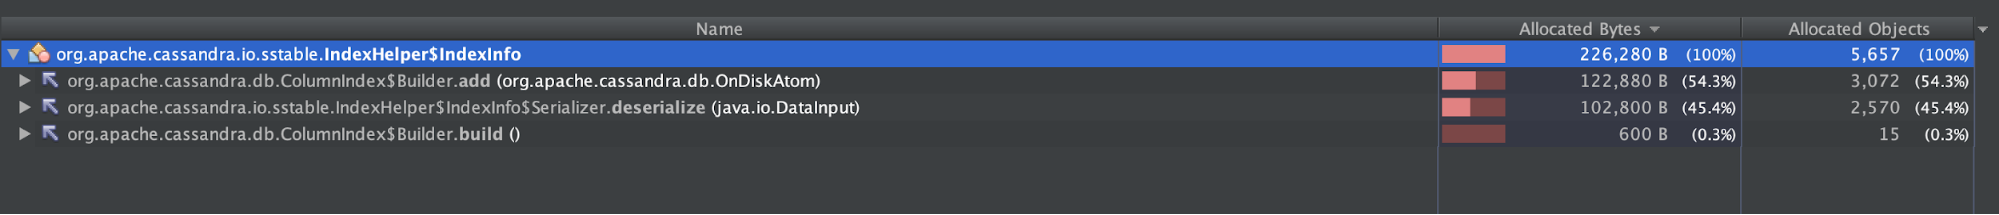
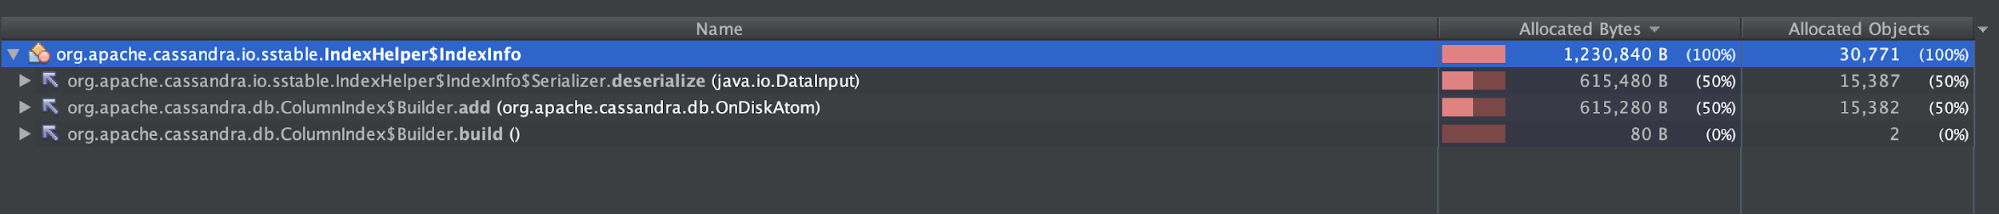
One Partition with 100K Rows (2.2.13)
The following three screenshots shows the number of IndexInfo objects instantiated during the write benchmark, during compaction, and a heap profile.
The partition grew to be ~40MB.
Objects created during tlp-stress
Objects created during subsequent major compaction

Heap profiled during tlp-stress and major compaction
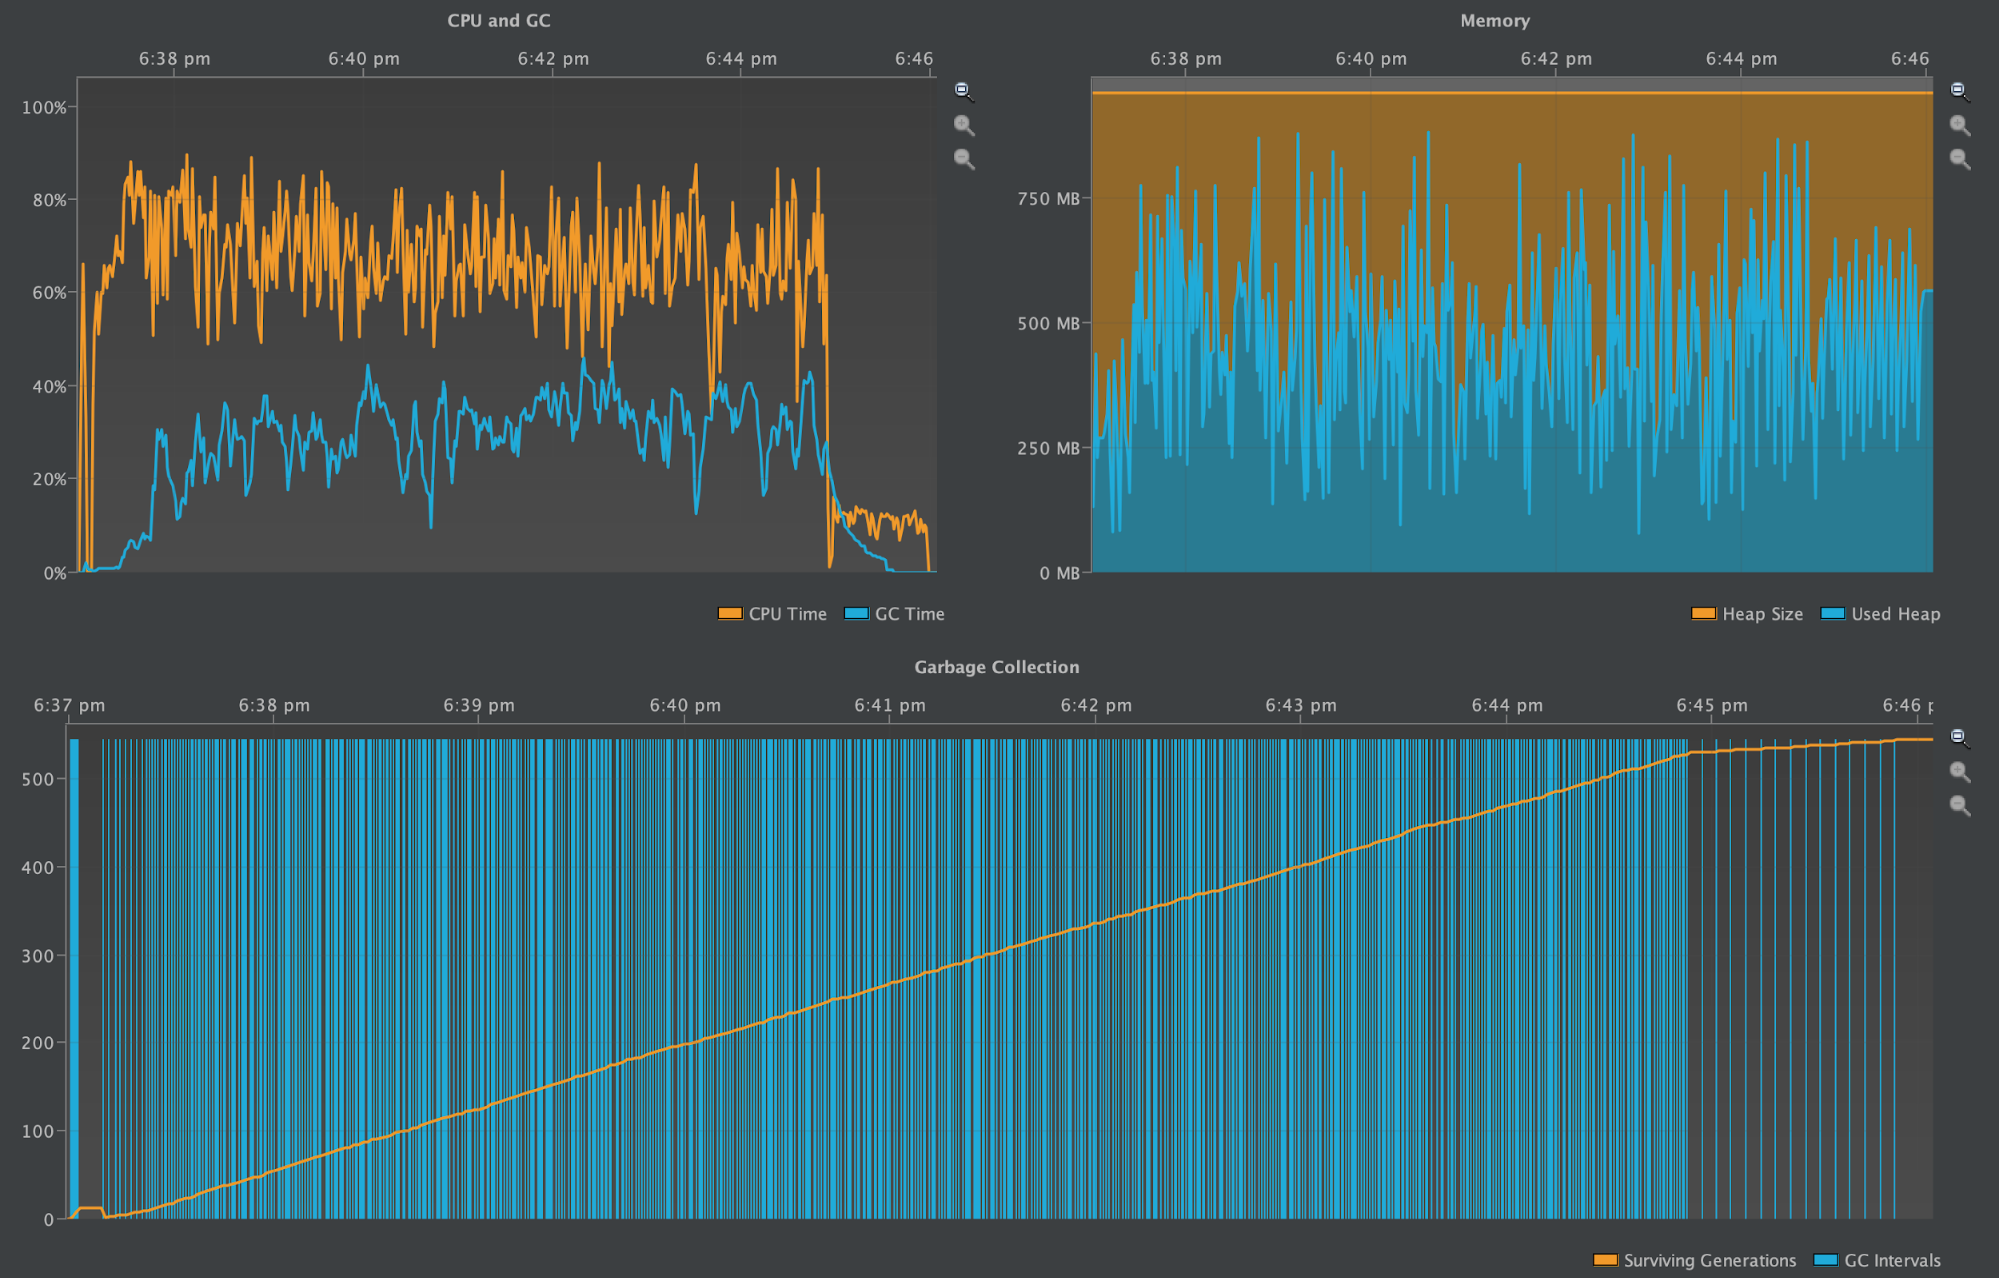
The above diagrams do not have their x-axis expanded to the full width, but still encompass the startup, stress test, flush, and compaction periods of the benchmark.
When stress testing starts with tlp-stress the CPU Time and Surviving Generations starts to climb. During this time the heap also starts to increase and decrease more frequently as it fills up and then the Garbage Collector cleans it out. In these diagrams the garbage collection intervals are easy to identify and isolate from one another.
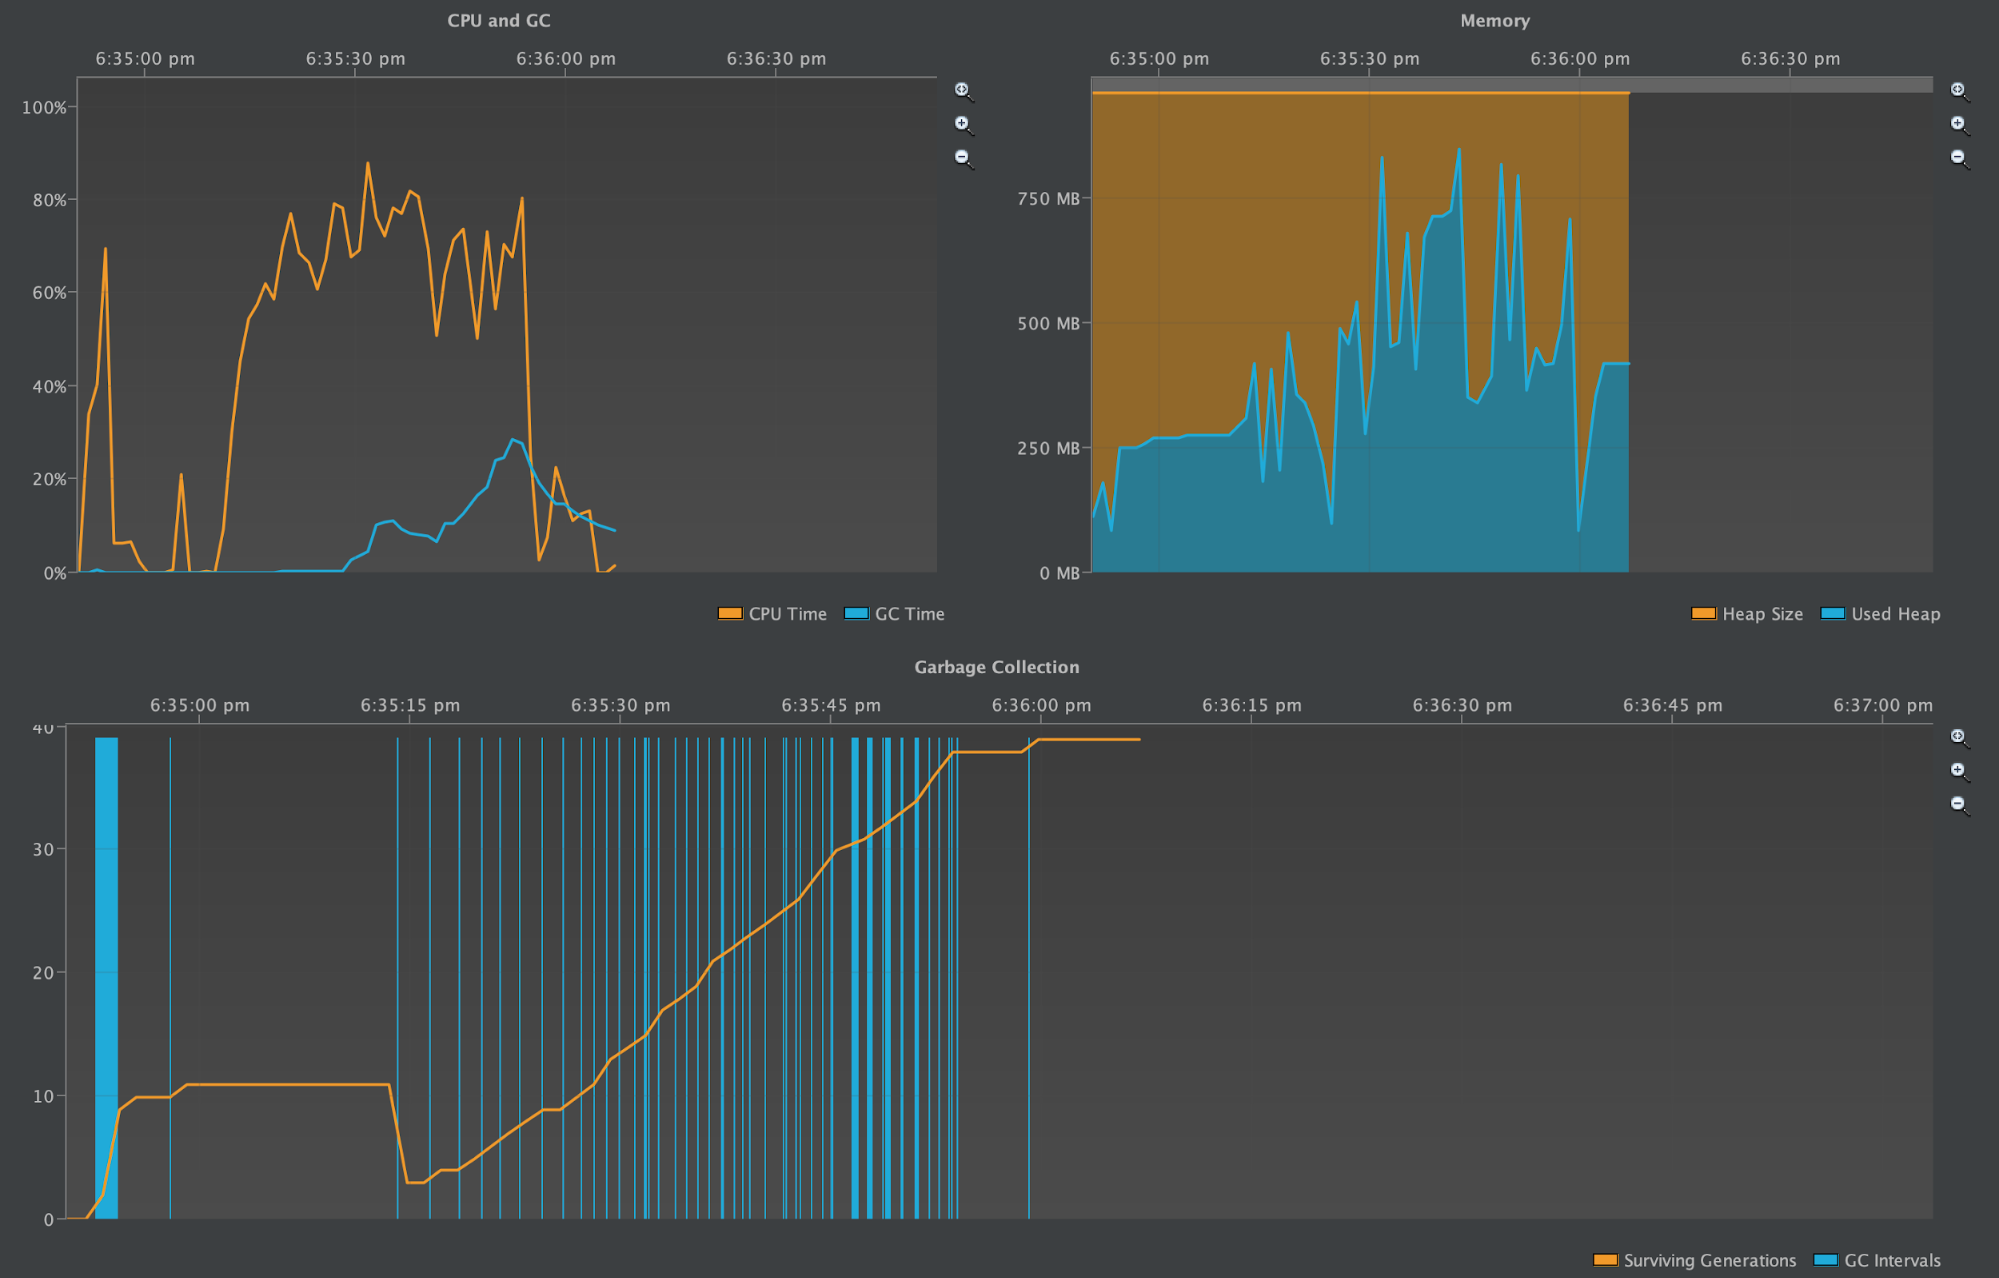
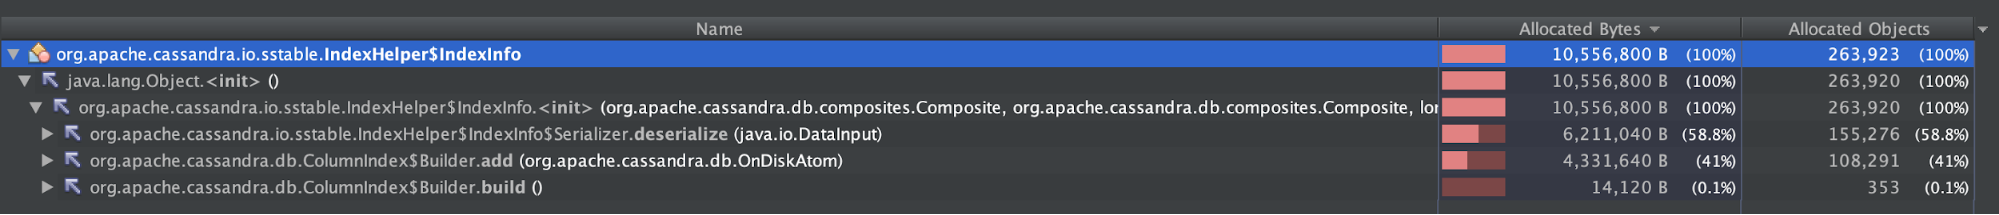
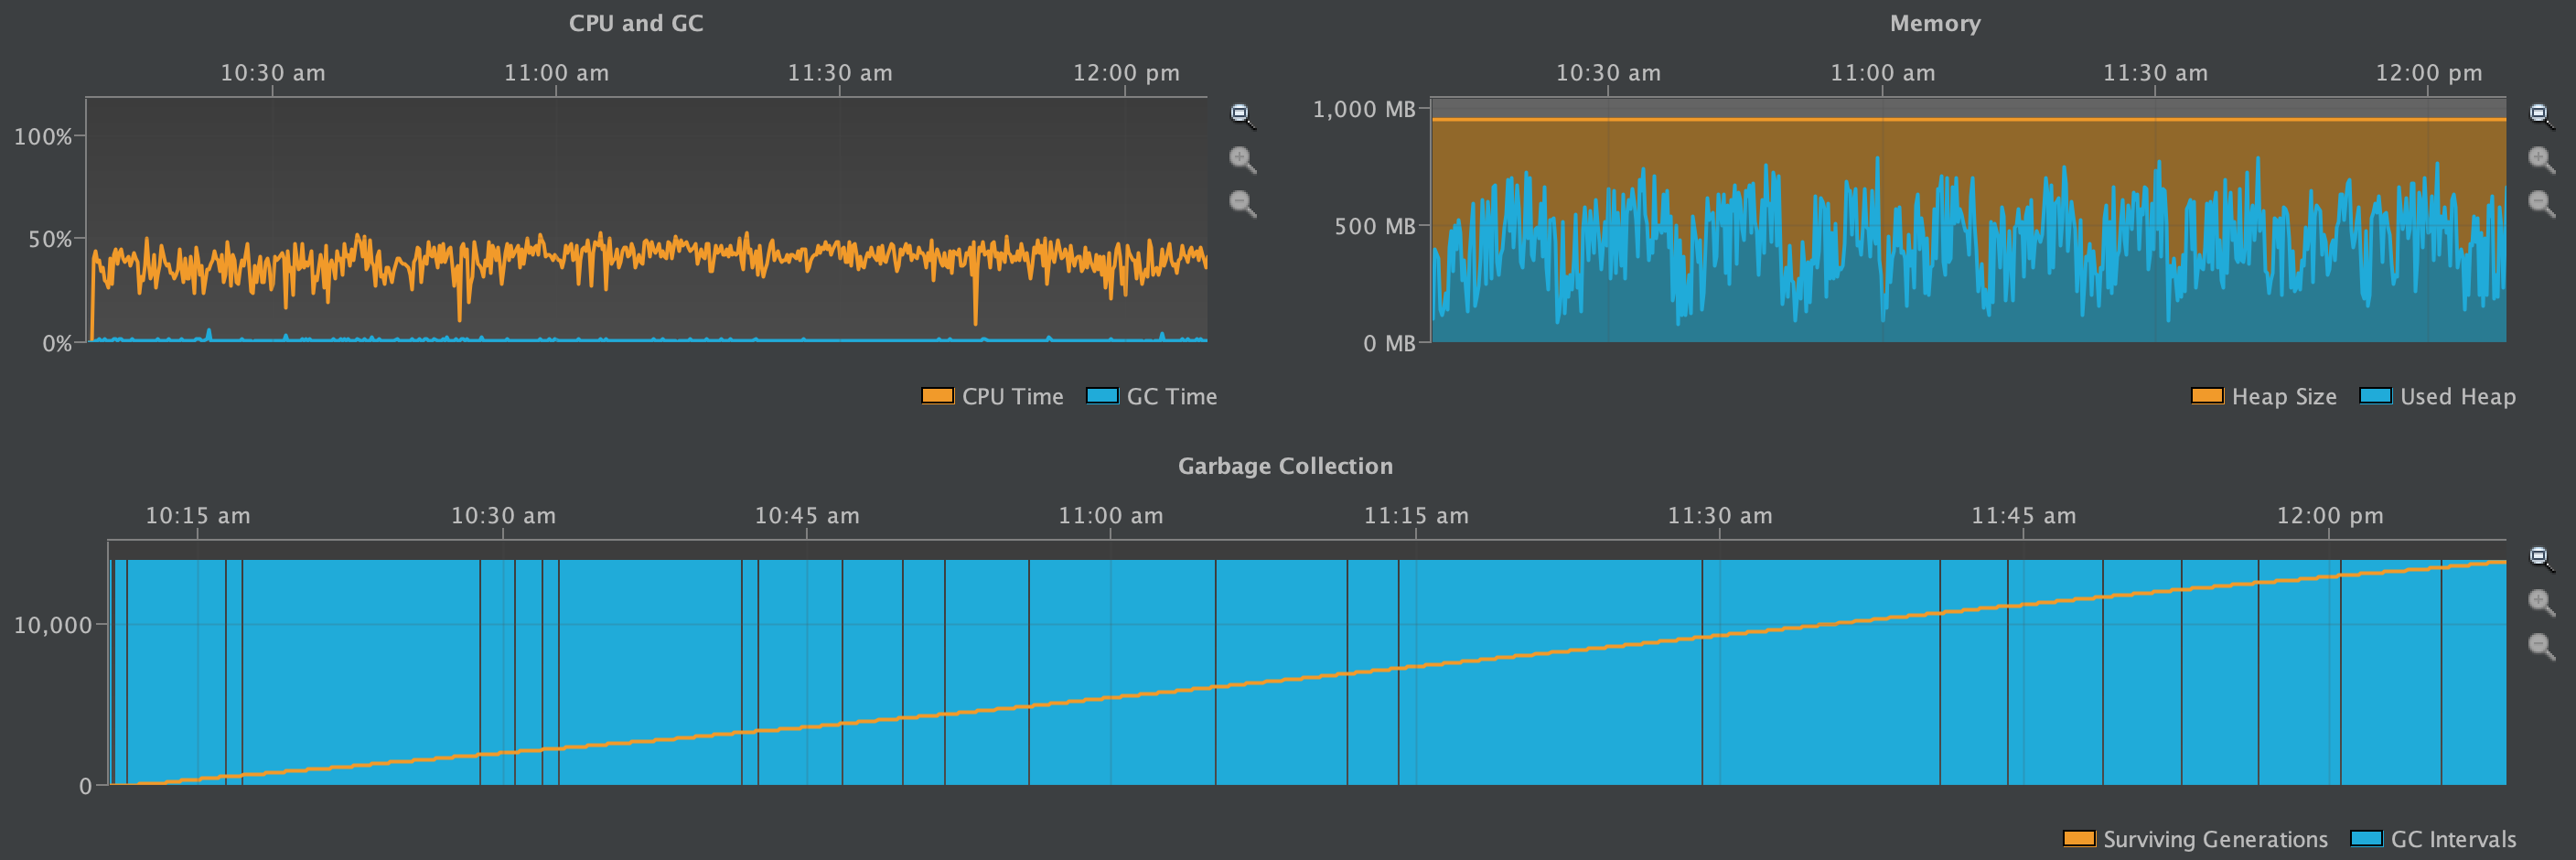
One Partition with 1M Rows (2.2.13)
Here, the first two screenshots show the number of IndexInfo objects instantiated during the write benchmark and during the subsequent compaction process. The third screenshot shows the CPU & GC Pause Times and the heap profile from the time writes started through when the compaction was completed.
The partition grew to be ~400MB.
Already at this size the Cassandra JVM is GC thrashing and has occasionally Out-of-Memory crashed.
Objects created during tlp-stress
Objects created during subsequent major compaction
Heap profiled during tlp-stress and major compaction
The above diagrams display a longer running benchmark, with the quiet period during the startup barely noticeable on the very left-hand side of each diagram. The number of garbage collection intervals and the oscillations in heap size are far more frequent. The GC Pause Time during the stress testing period is now consistently higher and comparable to the CPU Time. It only dissipates when the benchmark performs the flush and compaction.
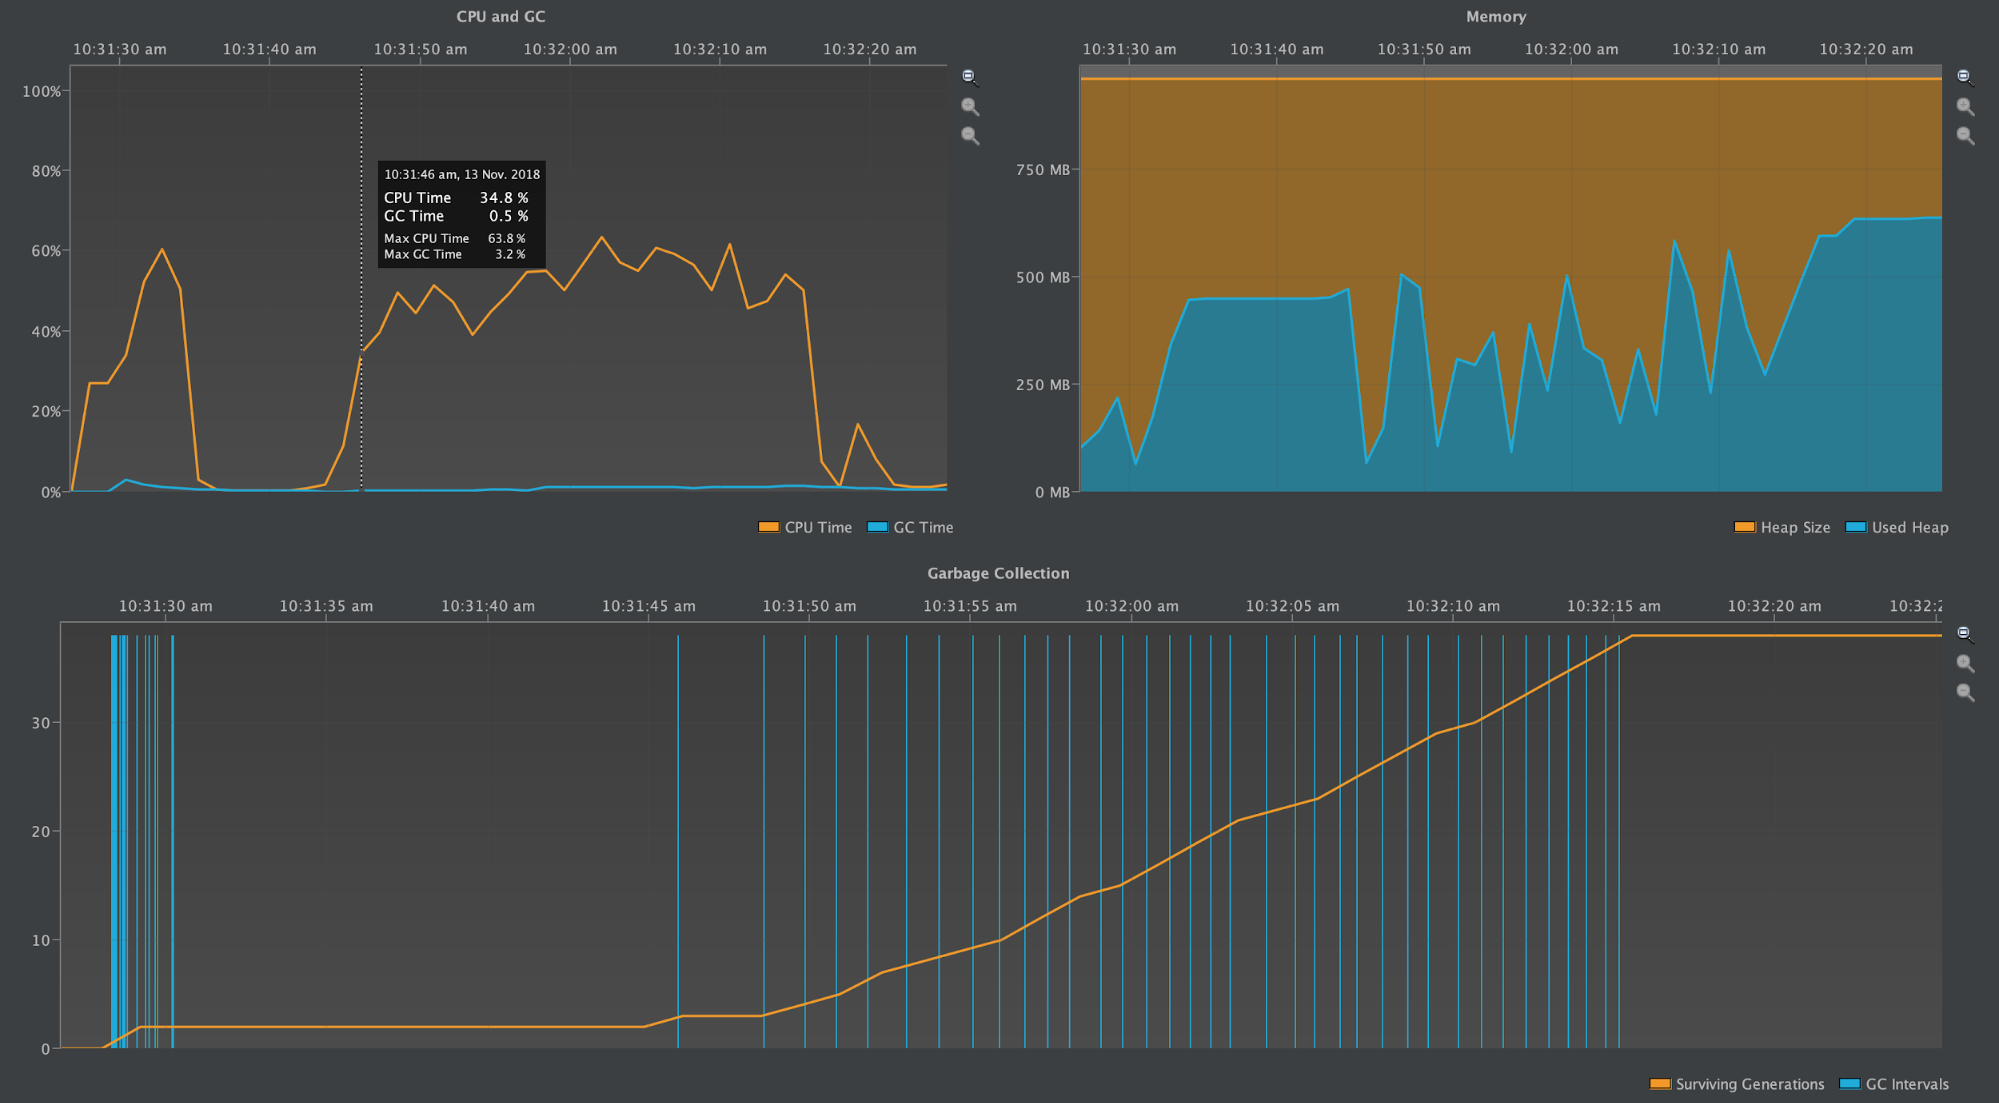
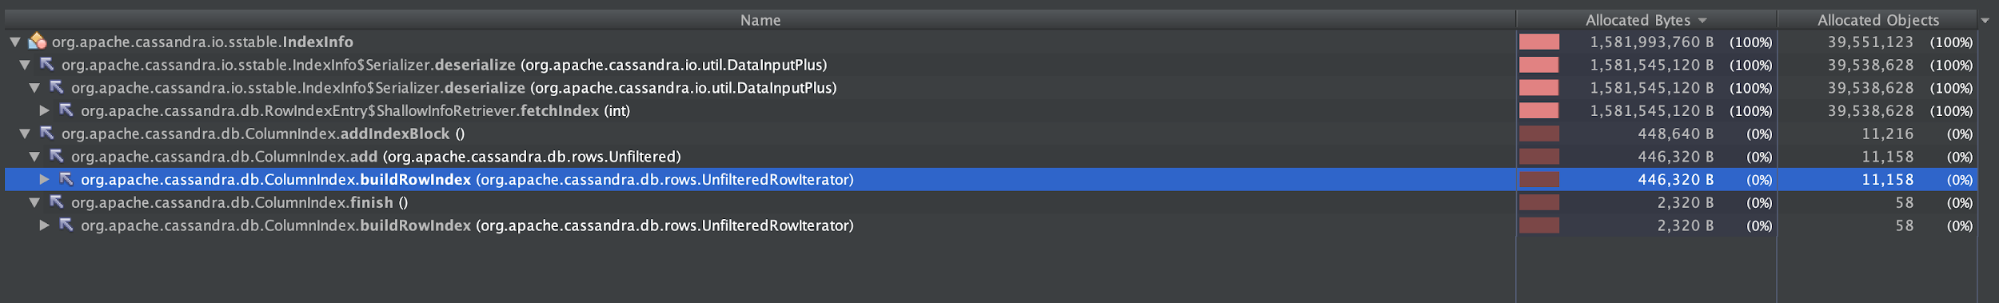
One Partition with 10M Rows (2.2.13)
In this final test of Cassandra version 2.2.13, the results were difficult to reproduce reliably, as more often than not this test Out-of-Memory crashed from GC heap pressure.
The first two screenshots show the number of IndexInfo objects instantiated during the write benchmark and during the subsequent compaction process. The third screenshot shows the GC Pause Time and the heap profile from the time writes started until compaction was completed.
The partition grew to be ~4GB.
Objects created during tlp-stress
Objects created during subsequent major compaction
Heap profiled during tlp-stress and major compaction
The above diagrams display consistently very high GC Pause Time compared to CPU Time. Any Cassandra node under this much duress from garbage collection is not healthy. It is suffering from high read latencies, could become blacklisted by other nodes due to its lack of responsiveness, and even crash altogether from Out-of-Memory errors (as it did often during this benchmark).
Wide Partitions in Cassandra 3.11.3
Benchmarks were against Cassandra 3.11.3
In this series, the graphs demonstrate how IndexInfo objects are created either from memtable flushes or from deserialization off disk. The ShallowIndexEntry is used in Cassandra 3.11.3 when deserializing the IndexInfo objects from the -Index.db file.
Neither form of IndexInfo objects reside long in the heap and thus the GC Pause Time is barely visible in comparison to Cassandra 2.2.13 despite the additional numbers of IndexInfo objects created via deserialization.
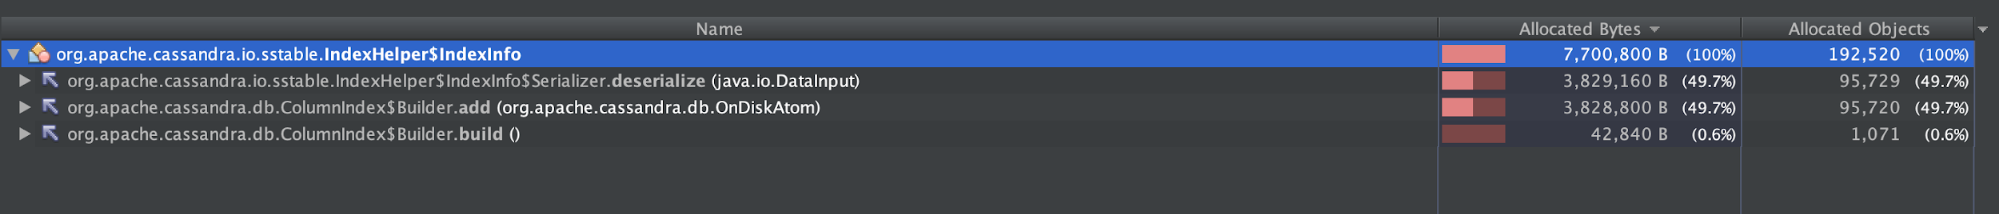
One Partition with 100K Rows (3.11.3)
As with the earlier version test of this size, the following two screenshots shows the number of IndexInfo objects instantiated during the write benchmark and during the subsequent compaction process. The third screenshot shows the CPU & GC Pause Time and the heap profile from the time writes started through when the compaction was completed.
The partition grew to be ~40MB, the same as with Cassandra 2.2.13
Objects created during tlp-stress
Objects created during subsequent major compaction

Heap profiled during tlp-stress and major compaction
The diagrams above are roughly comparable to the first diagrams presented under Cassandra 2.2.13, except here the x-axis is expanded to full width. Note there are significantly more instantiated IndexInfo objects, but barely any noticeable GC Pause Time.
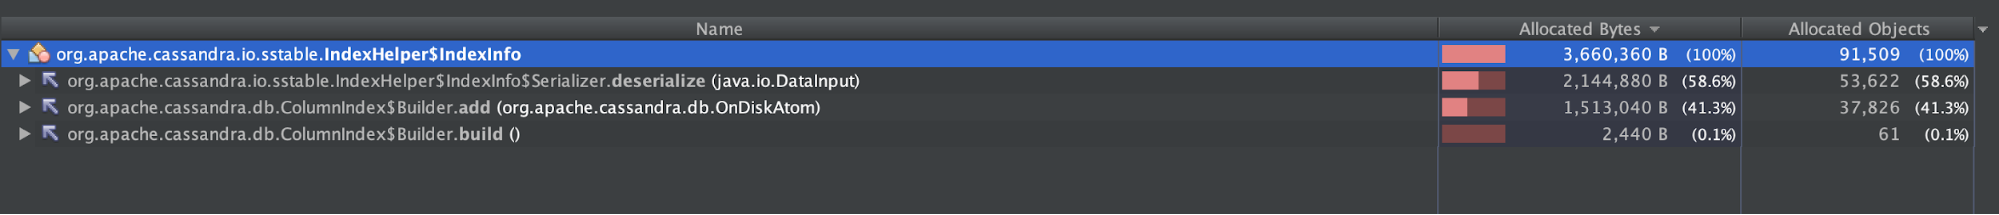
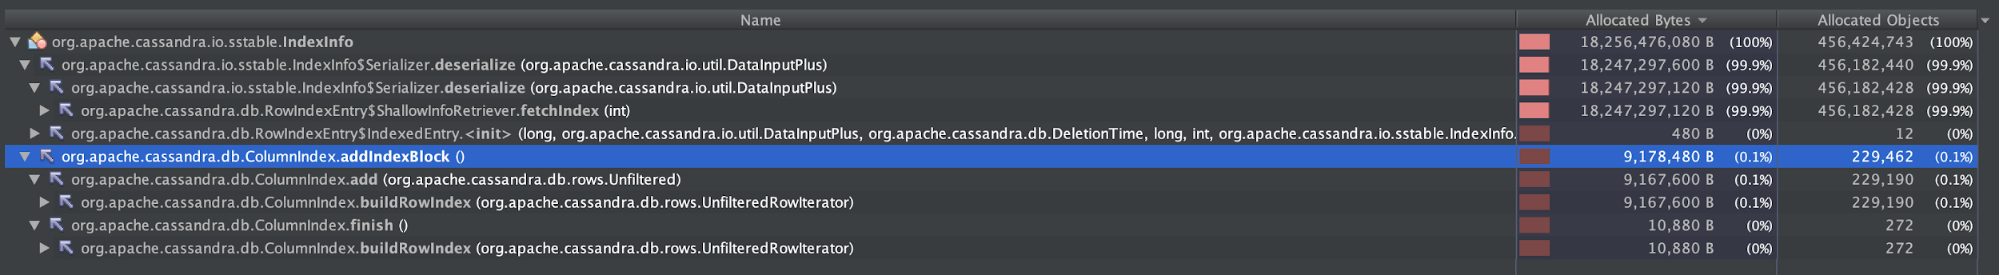
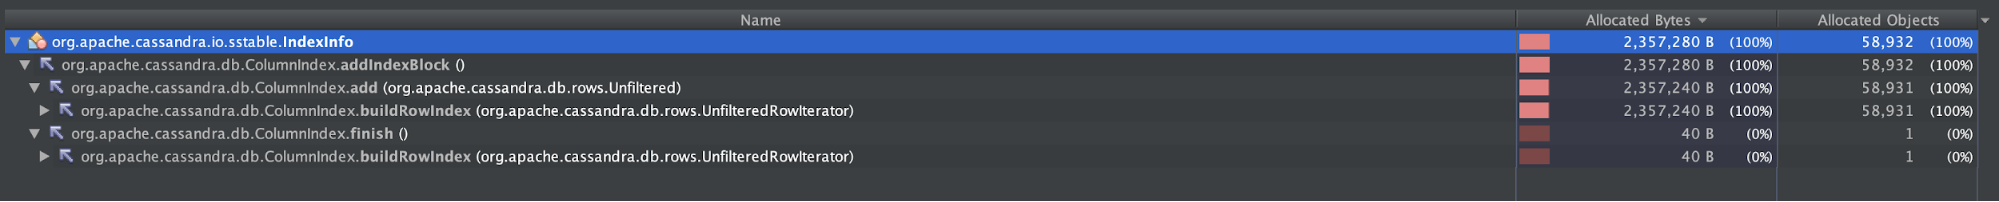
One Partition with 1M Rows (3.11.3)
Again, the first two screenshots show the number of IndexInfo objects instantiated during the write benchmark and during the subsequent compaction process. The third screenshot shows the CPU & GC Pause Time and the heap profile over the time writes started until the compaction was completed.
The partition grew to be ~400MB, the same as with Cassandra 2.2.13
Objects created during tlp-stress
Objects created during subsequent major compaction
Heap profiled during tlp-stress and major compaction
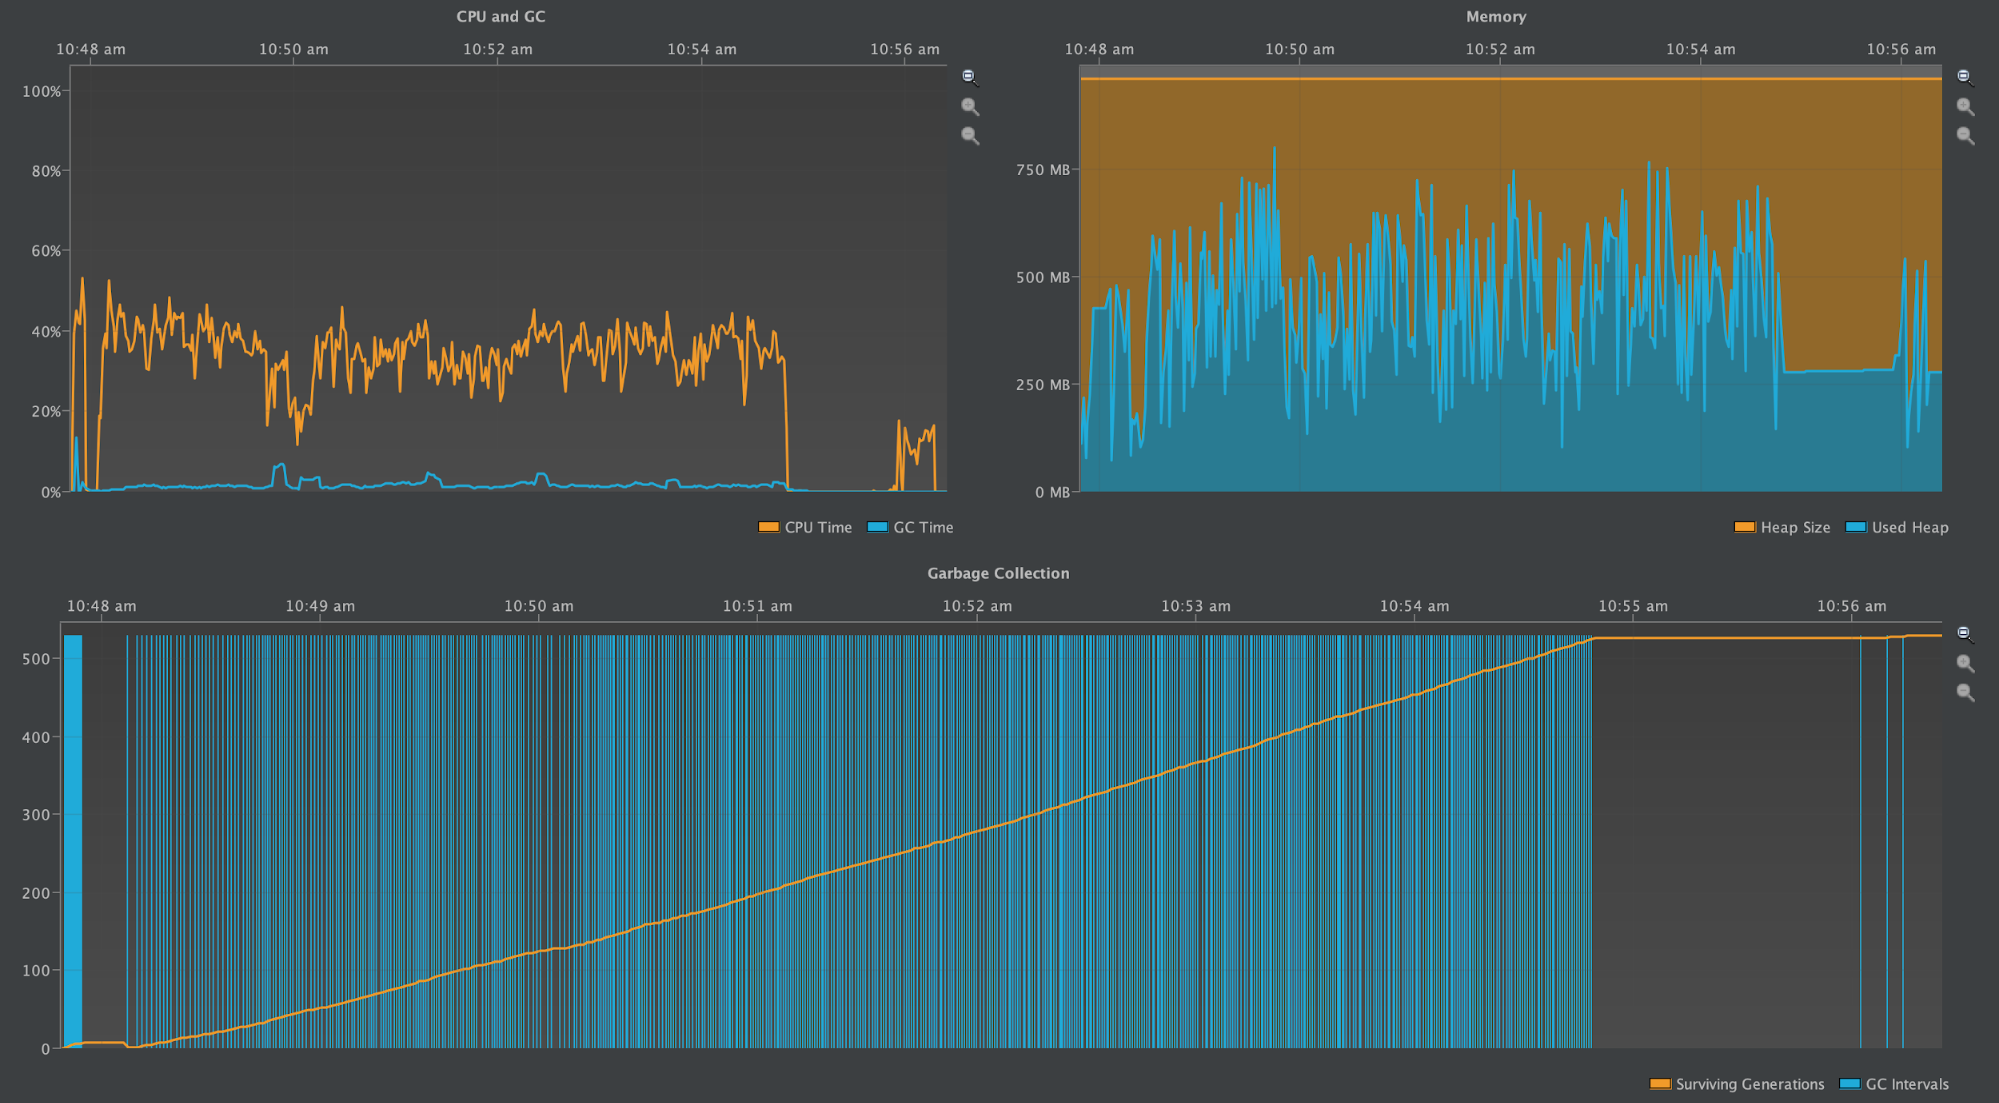
The above diagrams show a wildly oscillating heap as many IndexInfo objects are created, and shows many garbage collection intervals, yet the GC Pause Time remains low, if at all noticeable.
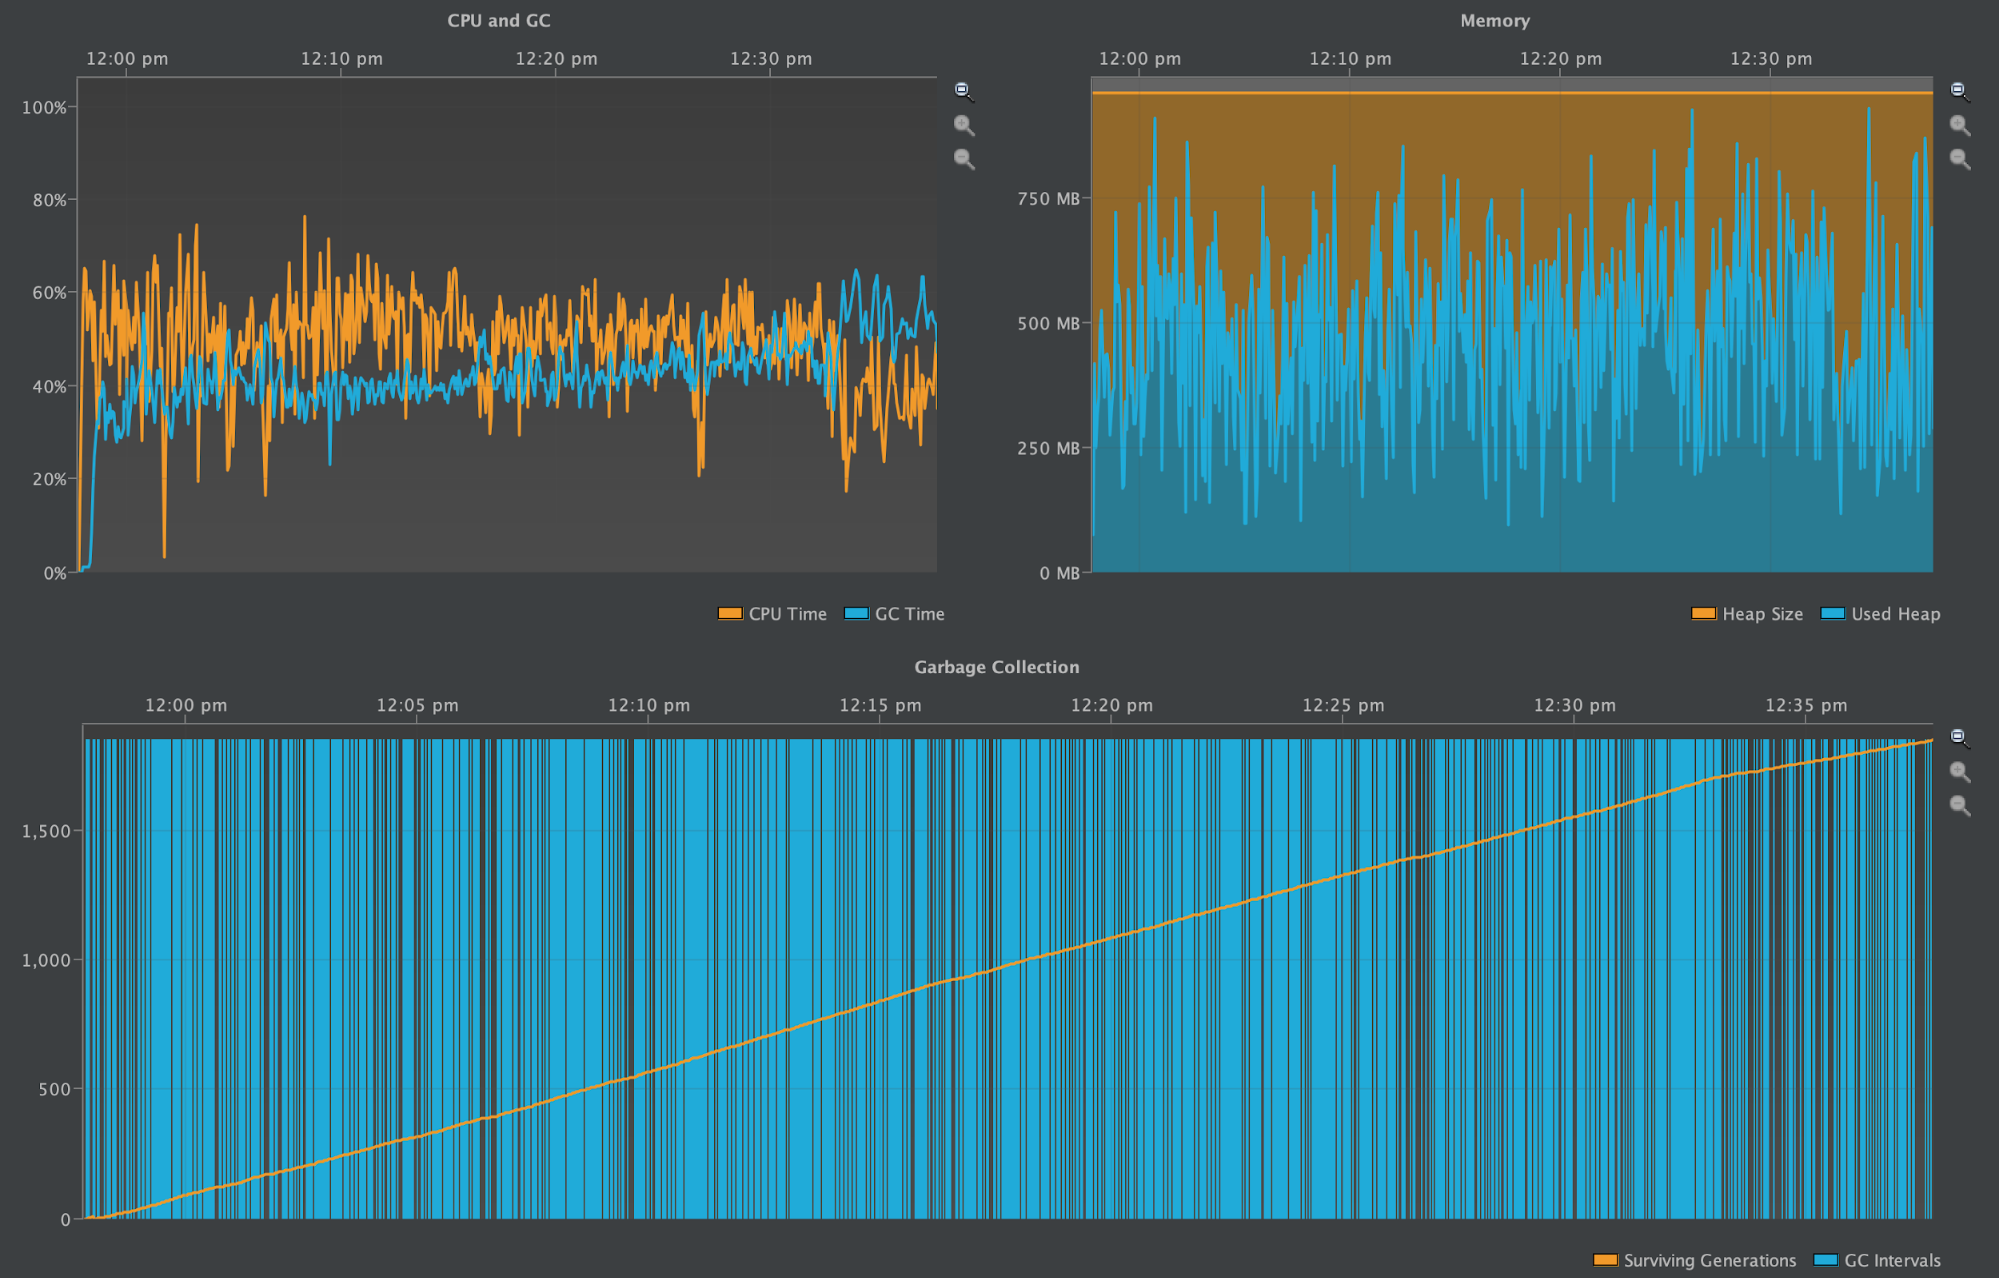
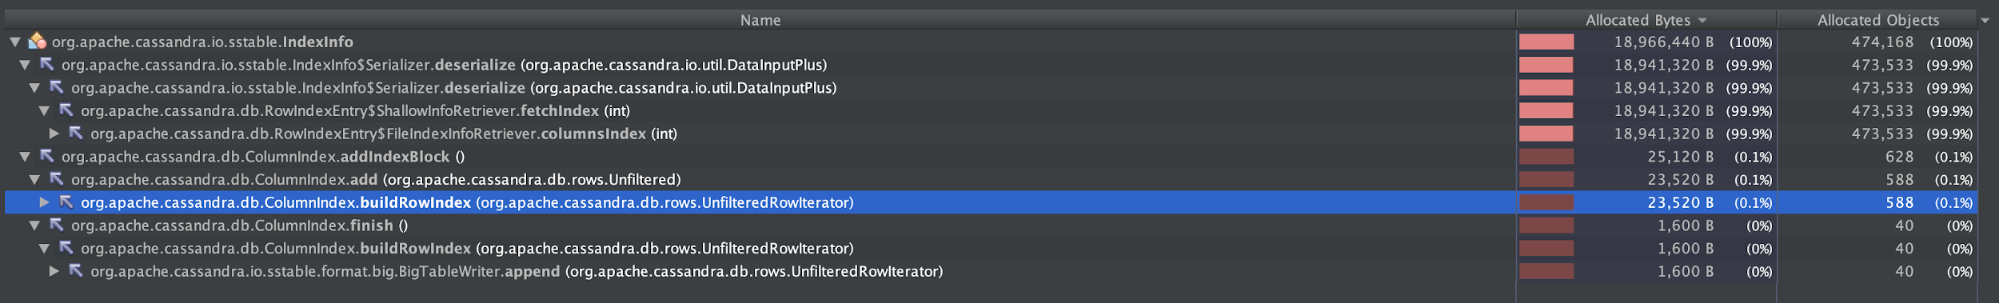
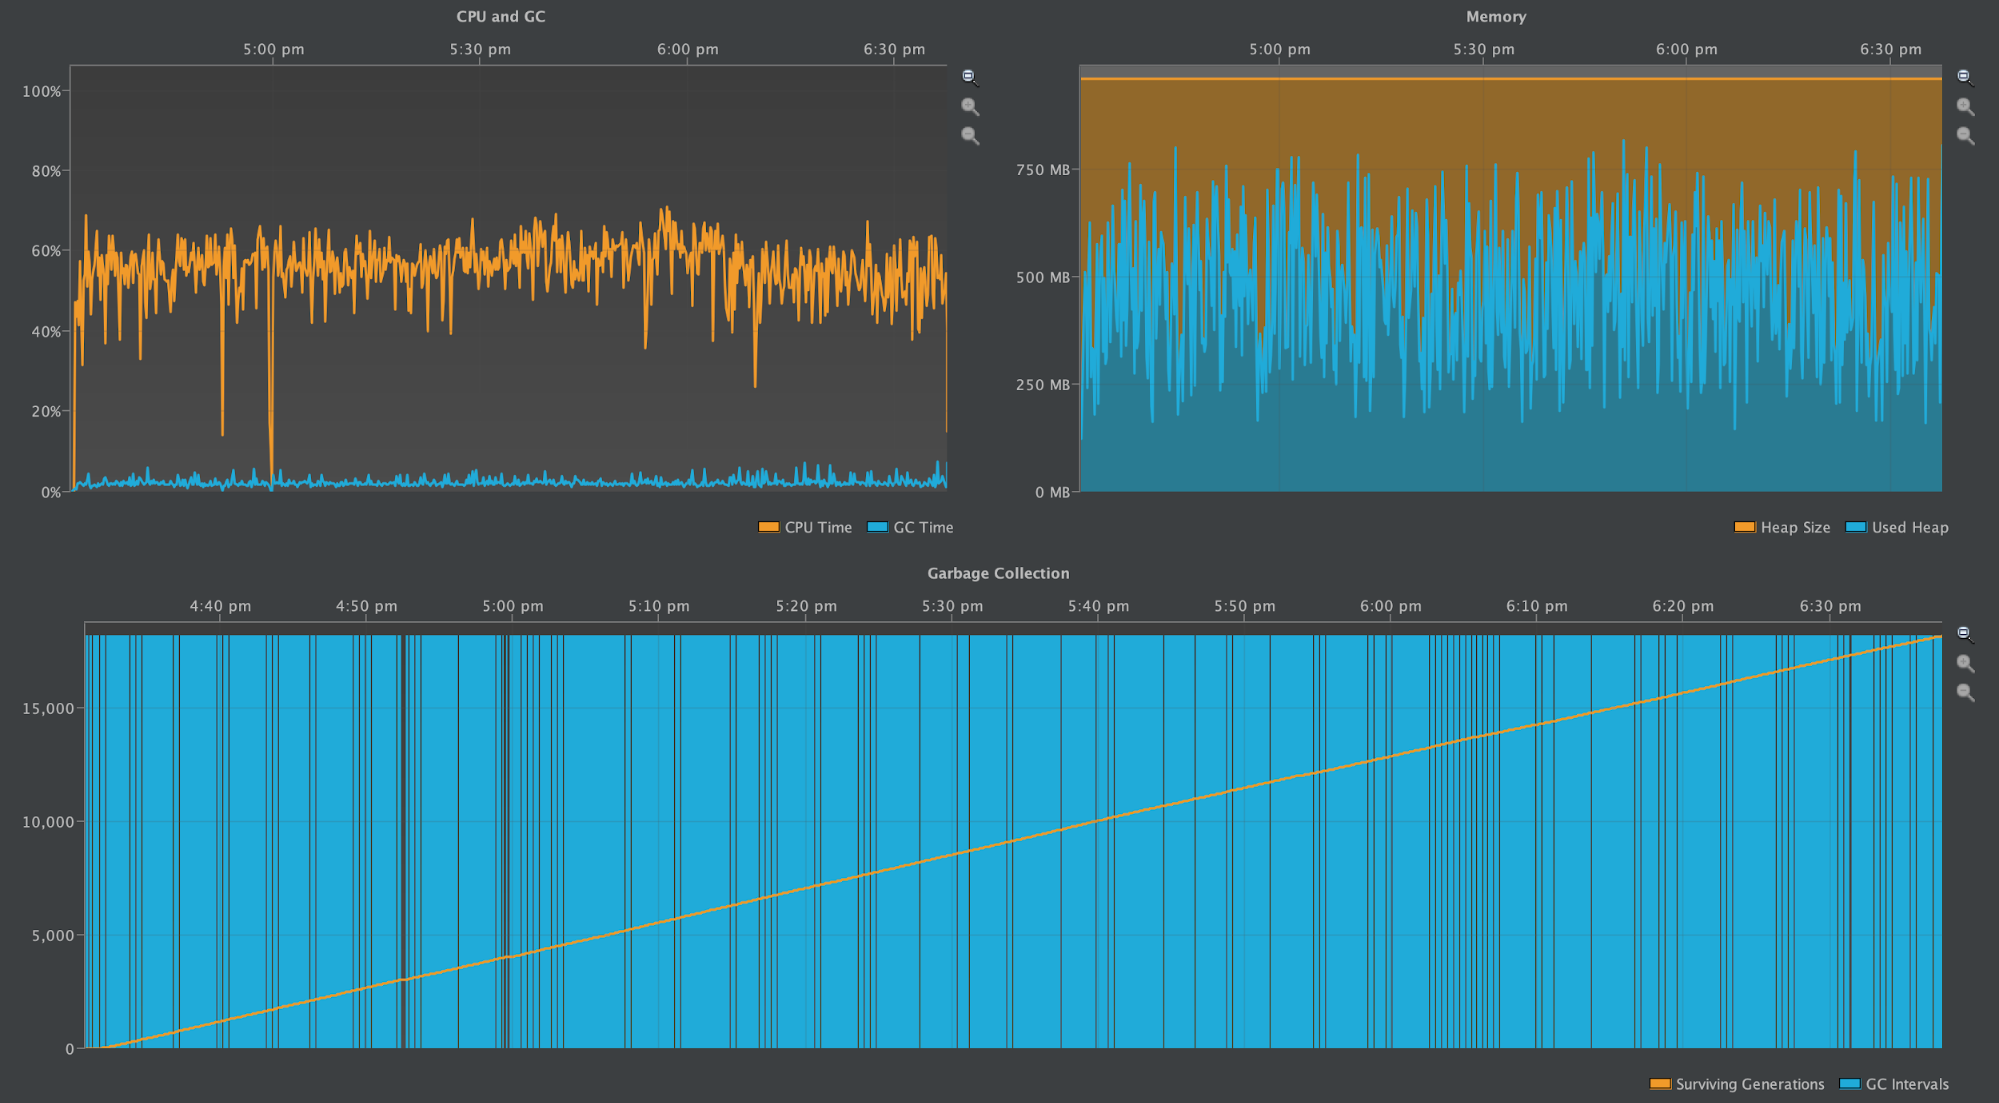
One Partition with 10M Rows (3.11.3)
Here again, the first two screenshots show the number of IndexInfo objects instantiated during the write benchmark and during the subsequent compaction process. The third screenshot shows the CPU & GC Pause Time and the heap profile over the time writes started until the compaction was completed.
The partition grew to be ~4GB, the same as with Cassandra 2.2.13
Objects created during tlp-stress
Objects created during subsequent major compaction
Heap profiled during tlp-stress and major compaction
Unlike this profile in 2.2.13, the cluster remains stable as it was when running 1M Rows per Partition. The above diagrams display an oscillating heap when IndexInfo objects are created, and many garbage collection intervals, yet GC Pause Time remains low, if at all noticeable.
Maximum Rows in 1GB Heap (3.11.3)
In an attempt to push Cassandra 3.11.3 to the limit, we ran a test to see how much data could be written to a single Partition before Cassandra Out-of-Memory crashed.
The result was 30M+ rows, which is ~12GB of data on disk.
This is similar to the limit of 17GB of data written to a single Partition as Robert Stupp found in CASSANDRA-9754 when using a 5GB java heap.
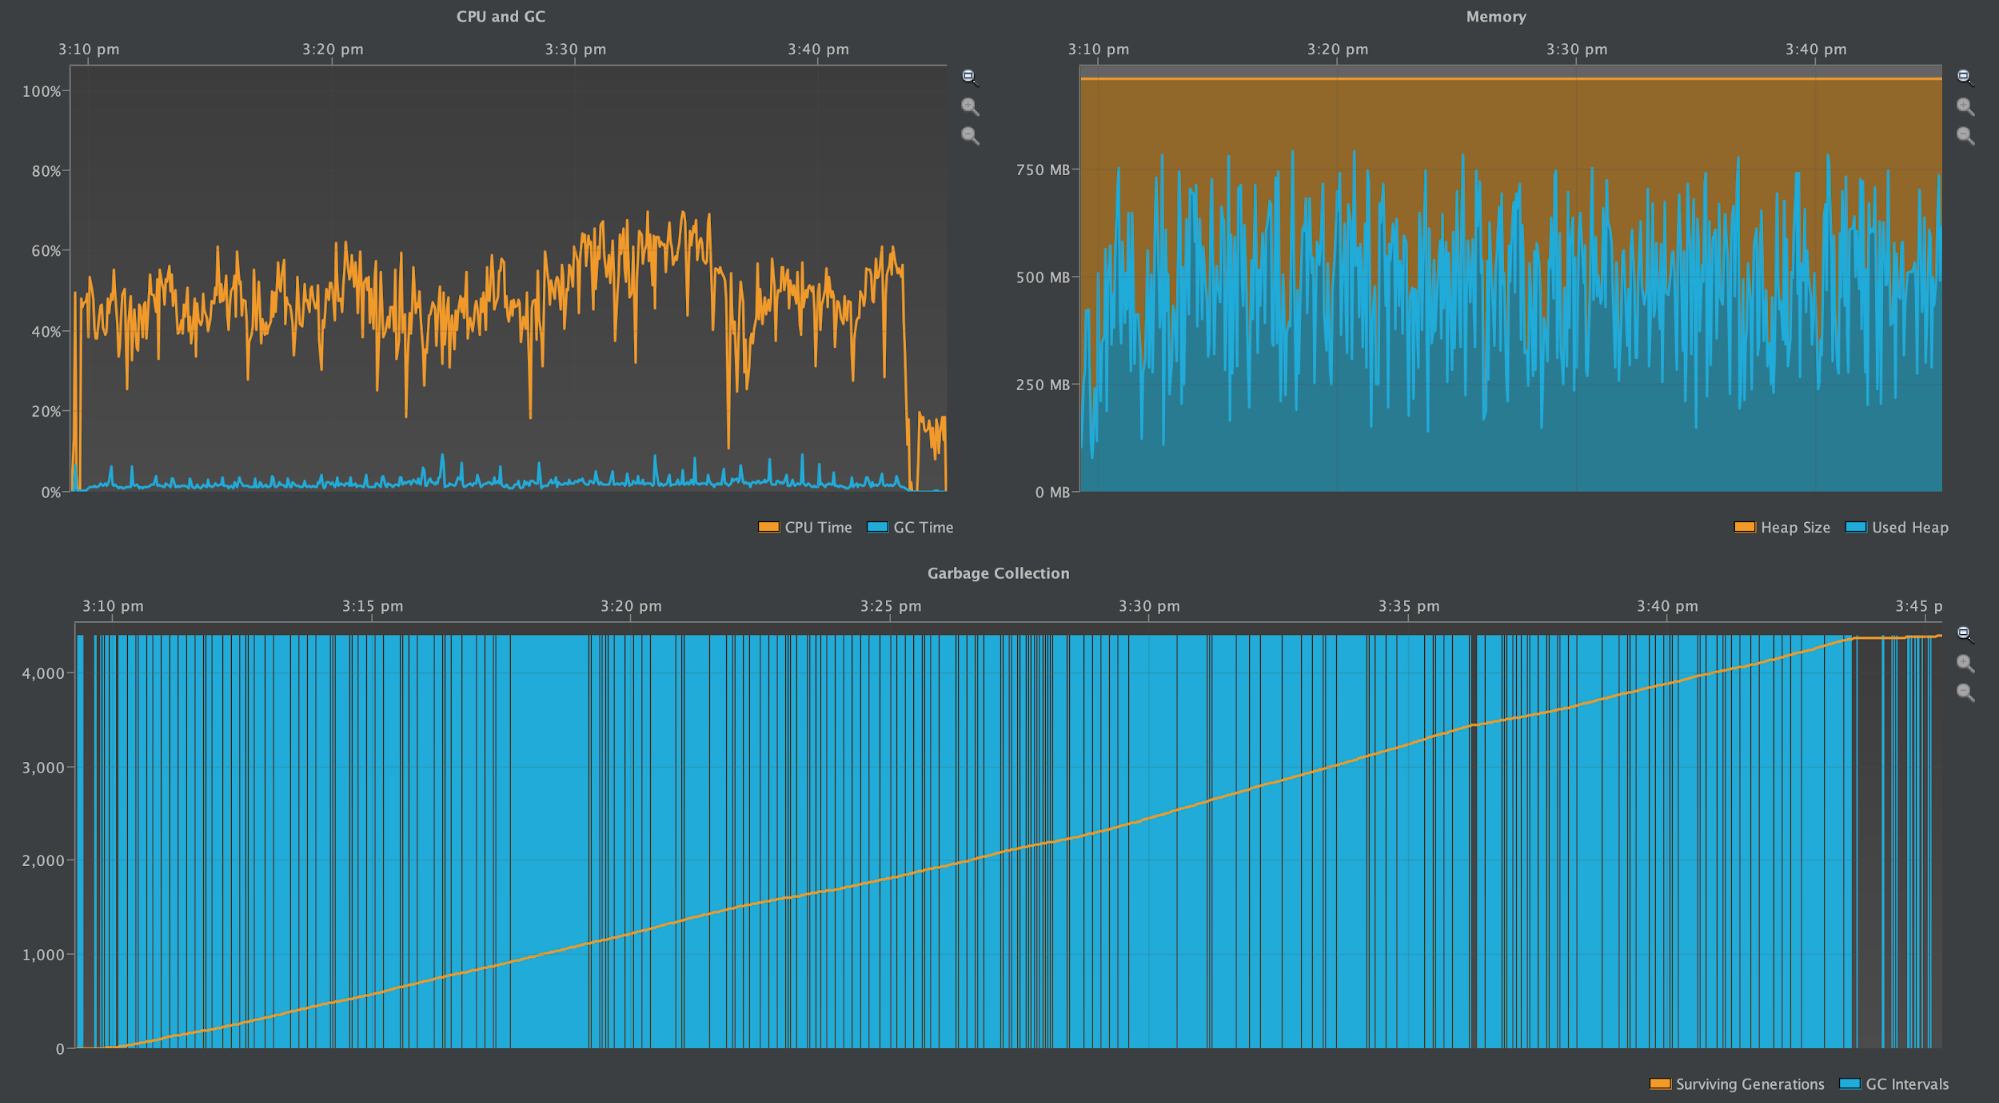
What about Reads
The following graph reruns the benchmark on Cassandra version 3.11.3 over a longer period of time with a read to write ratio of 10:1. It illustrates that reads of wide Partitions do not create the heap pressure that writes do.
Conclusion
While the 400MB community recommendation for Partition size is clearly appropriate for version 2.2.13, version 3.11.3 shows that performance improvements have created a tremendous ability to handle wide Partitions and they can easily be an order of magnitude larger than earlier versions of Cassandra without nodes crashing through heap pressure.
The trade-off for better supporting wide Partitions in Cassandra 3.11.3 is increased read latency as Row offsets now need to be read off disk. However, modern SSDs and kernel pagecaches take advantage of larger configurations of physical memory providing enough IO improvements to compensate for the read latency trade-offs.
The improved stability and falling back on better hardware to deal with the read latency issue allows Cassandra operators to worry less about how to store massive amounts of data in different schemas and unexpected data growth patterns on those schemas.
Come CASSANDRA-9754 custom B+ tree structures will be used to more effectively lookup the deserialised Row offsets and further avoid the deserialization and instantiation of short-lived unused IndexInfo objects.
![]()